. 2016 Feb 17;138(6):1852-9.
doi: 10.1021/jacs.5b06806. Epub 2016 Feb 5.

Harnessing Redox Cross-Reactivity To Profile Distinct Cysteine Modifications

Affiliations

Harnessing Redox Cross-Reactivity To Profile Distinct Cysteine Modifications

Jaimeen D Majmudar et al. J Am Chem Soc. .

Abstract

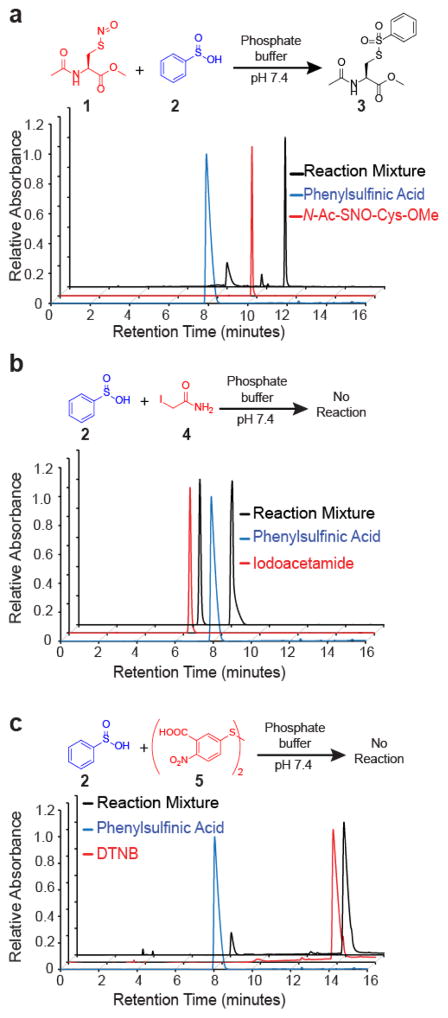
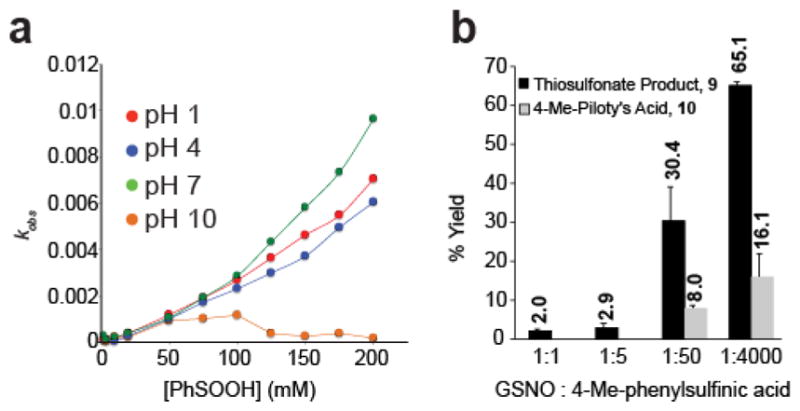
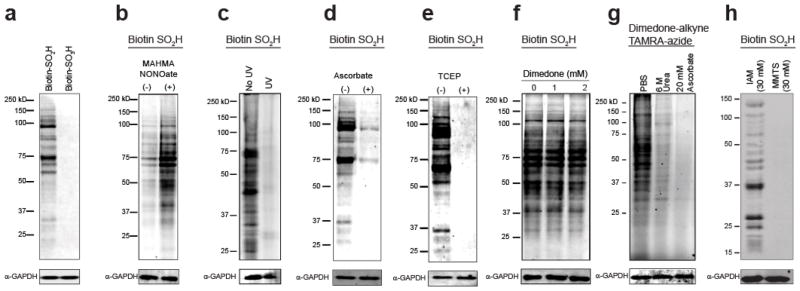
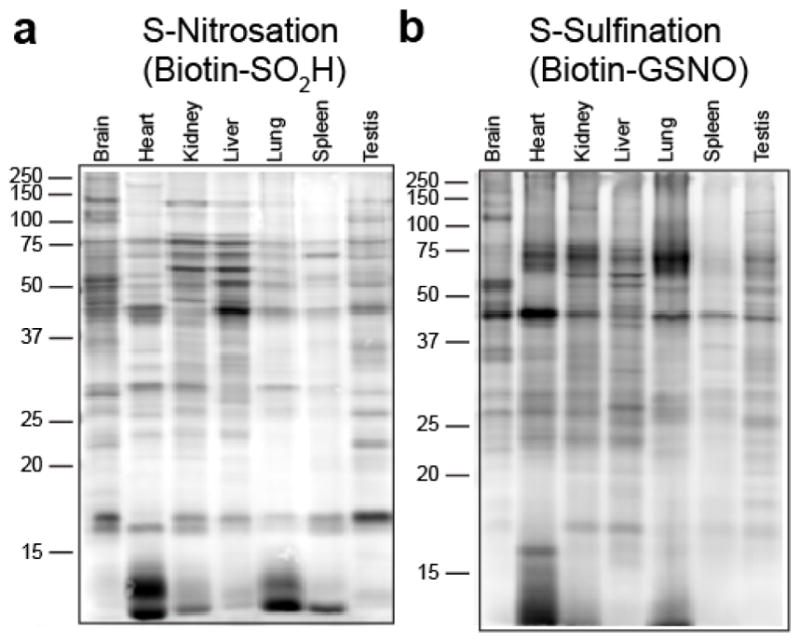
Cysteine S-nitrosation and S-sulfination are naturally occurring post-translational modifications (PTMs) on proteins induced by physiological signals and redox stress. Here we demonstrate that sulfinic acids and nitrosothiols react to form a stable thiosulfonate bond, and leverage this reactivity using sulfinate-linked probes to enrich and annotate hundreds of endogenous S-nitrosated proteins. In physiological buffers, sulfinic acids do not react with iodoacetamide or disulfides, enabling selective alkylation of free thiols and site-specific analysis of S-nitrosation. In parallel, S-nitrosothiol-linked probes enable enrichment and detection of endogenous S-sulfinated proteins, confirming that a single sulfinic acid can react with a nitrosothiol to form a thiosulfonate linkage. Using this approach, we find that hydrogen peroxide addition increases S-sulfination of human DJ-1 (PARK7) at Cys106, whereas Cys46 and Cys53 are fully oxidized to sulfonic acids. Comparative gel-based analysis of different mouse tissues reveals distinct profiles for both S-nitrosation and S-sulfination. Quantitative proteomic analysis demonstrates that both S-nitrosation and S-sulfination are widespread, yet exhibit enhanced occupancy on select proteins, including thioredoxin, peroxiredoxins, and other validated redox active proteins. Overall, we present a direct, bidirectional method to profile select redox cysteine modifications based on the unique nucleophilicity of sulfinic acids.


Figures

Figure 1
Figure 1
Sulfinic acid reactivity in phosphate buffer. (a) Phenylsulfinic acid (2, 20 mM) reacts with N-acetyl S-nitroso cysteine methyl ester (1, 5 mM) to form thiosulfonate 3. Absorbance was measured at 283 nm. (b) No additional peaks are observed when phenylsulfinic acid is incubated with iodoacetamide in PBS for 30 minutes. Absorbance was measured at 291 nm. (c) Phenylsulfinic acid, 2, does not react with the activated disulfide DTNB, 5. Absorbance was measured at 291 nm for phenylsulfinic acid and 265 nm for DTNB and the reaction mixture.
Figure 2
Figure 2
Reaction kinetics and by-product analysis. (a) Reaction rate between phenylsulfinic acid and GSNO at various pHs. (b) Percent yield of the thiosulfonate product and the 4-methyl-Piloty’s acid product.
Figure 3
Figure 3
Sulfinic acid probes selectively label S-nitrosothiols in HEK293T cell lysates. Unless otherwise noted, all lysates are denatured in 6 M urea supplemented with 50 mM iodoacetamide (IAM). (a) Biotin-SO2H, but not biotin-SO3H, labels S-nitrosothiols in lysates. (b) Biotin-SO2H labeling increases following pre-treatment with MAHMA NONOate, a nitric oxide donor before IAM addition. (c) UV photolysis (365 nm) pre-treatment eliminates biotin-SO2H labeling. (d) Biotin-SO2H labeling is eliminated by pre-treatment with ascorbate. (e) The products of biotin-SO2H labeling are sensitive to post-treatment by the reductant TCEP. (f) The sulfenic acids probe dimedone does not reduce biotin-SO2H labeling. (g) Denaturing buffers or ascorbate reduce dimedone-alkyne labeling of sulfenic acids. Following a 1 hour incubation with dimedone alkyne, lysates were chloroform/methanol precipitated and mixed with TBTA, CuSO4, TCEP, and TAMRA-azide for 1 hour in PBS before gel analysis. (h) MMTS and IAM both react with free thiols, but MMTS liberates methane sulfinic acid and interferes biotin-SO2H labeling of S-nitrosated proteins.
Figure 4
Figure 4
Labeling of recombinant human GAPDH with biotin-SO2H. (a) GAPDH labeling is observed only in the presence of MAHMA NONOate, and eliminated by pre-treatment with ascorbate. (b) GAPDH is labeled by the trans-nitrosation donor GSNO, and eliminated by pre-treatment with the reducing agent DTT.
Figure 5
Figure 5
Biotin-GSNO (1 mM) labels a unique profile of S-sulfinated proteins in HEK293T cell lysates. (a) Biotin-GSNO labeling is not competed by S-methylglutathione (1 mM). (b) GSNO competes with biotin-GSNO for labeling native S-sulfinated proteins. (c) Biotin-GSNO labeling of S-sulfination is unaffected by dimedone (1 mM). (d) Proteins first labeled with biotin-GSNO are then lost after TCEP (5 mM) addition. (e) Peroxide pre-treatment in iodoacetamide alkylated lysates eliminates biotin-GSNO labeling, suggesting terminal oxidation of sulfinic acids to non-reactive sulfonic acids. (f) Biotin-GSSG, a putative contaminant in biotin-GSNO, does not label any proteins.
Figure 6
Figure 6
Analysis of thiosulfonate formation on recombinant human DJ-1. Purified, recombinant DJ-1 was treated with buffer, 10 mM hydrogen peroxide, or 200 mM peroxide. Samples were treated with iodoacetamide (IAM) to block free thiols, and excess reagents were removed by gel filtration before incubating with GSNO. The relative abundance of each of the modified peptide was measured by mass spetrometry of trypic peptides. The peptide abundances were normalized to reflect relative changes within each condition. Error bars represent standard deviations of from three replicates. The control peptide E64–K89 showed no peroxide-dependent changes.
Figure 7
Figure 7
Profiling native S-nitrosation and S-sulfination in mouse tissues. (a) S-nitrosation profile of mouse tissues labeled with biotin-SO2H. (b) S-sulfination profile of mouse tissues labeled with biotin-GSNO using matched protein loading, fluorescence detection, and image settings.
Figure 8
Figure 8
Relative comparative protein-level occupancy of redox modifications. (a) Histogram of calculated relative occupancy ratios of S-nitrosated proteins (left) compared to S-sulfinated proteins (right), derived from label-free quantiation. (b) Comparative analysis of relative occupancy ratios of both S-nitrosated and S-sulfinated proteins reveals inherent preferences towards each redox modification. Arbitrary lines and color boundaries are presented, separating abundant, low occupancy proteins (grey), from highly S-nitrosated (blue), highly S-sulfinated (green), and proteins with enhanced occupancy for each modification (red).

Similar articles

Cited by

References

    1. Gruhlke MCH, Slusarenko AJ. Plant Physiol Biochem. 2012;59:98. - PubMed
    2. Giles GI, Jacob C. Biol Chem. 2002;383:375. - PubMed
    3. Paulsen CE, Carroll KS. Chem Rev. 2013;113:4633. - PMC - PubMed
    1. Majmudar JD, Martin BR. Biopolymers. 2014;101:173. - PMC - PubMed
    1. Paulsen CE, Carroll KS. Chem Rev. 2013;113:4633. - PMC - PubMed
    1. Hoffman S, Nolin J, McMillan D, Wouters E, Janssen-Heininger Y, Reynaert N. J Cell Biochem. 2015;116:884. - PMC - PubMed
    1. Andersson A, Hultberg B, Lindgren A. Atherosclerosis. 2000;151:535. - PubMed
    2. Maron BA, Tang SS, Loscalzo J. Antioxid Redox Signal. 2013;18:270. - PMC - PubMed
    3. Chung HS, Wang SB, Venkatraman V, Murray CI, Van Eyk JE. Circ Res. 2013;112:382. - PMC - PubMed

Publication types

MeSH terms

LinkOut - more resources