

Life span extension by targeting a link between metabolism and histone acetylation in Drosophila
- PMID: 26781291
- PMCID: PMC4772992
- DOI: 10.15252/embr.201541132
Life span extension by targeting a link between metabolism and histone acetylation in Drosophila
Abstract
Old age is associated with a progressive decline of mitochondrial function and changes in nuclear chromatin. However, little is known about how metabolic activity and epigenetic modifications change as organisms reach their midlife. Here, we assessed how cellular metabolism and protein acetylation change during early aging in Drosophila melanogaster. Contrary to common assumptions, we find that flies increase oxygen consumption and become less sensitive to histone deacetylase inhibitors as they reach midlife. Further, midlife flies show changes in the metabolome, elevated acetyl-CoA levels, alterations in protein-notably histone-acetylation, as well as associated transcriptome changes. Based on these observations, we decreased the activity of the acetyl-CoA-synthesizing enzyme ATP citrate lyase (ATPCL) or the levels of the histone H4 K12-specific acetyltransferase Chameau. We find that these targeted interventions both alleviate the observed aging-associated changes and promote longevity. Our findings reveal a pathway that couples changes of intermediate metabolism during aging with the chromatin-mediated regulation of transcription and changes in the activity of associated enzymes that modulate organismal life span.
Keywords: acetylation; ageing; chromatin; metabolism.
© 2016 The Authors. Published under the terms of the CC BY NC ND 4.0 license.
Figures

In a mixed population, flies reach the end of a “premortality plateau phase” (PMP) at an age of 4 weeks, where 90% of the flies are still alive. We define this age as their “midlife” point. At this stage, the rate of the population decline accelerates from 1% (plateau) per day in the previous 10 days to 3.5% per day in the following 10 days. Median survival = 39 days, N = 260.
Oxygen consumption rate (OCR) quantification shows a decreased OCR in old whole heads compared to young flies. Data were normalized to 1‐week‐old flies (young flies). N = 14 young vs. N = 12 old.
At midlife, flies show a reduced physical activity compared to young flies. N = 7 young vs. N = 5 midlife.
Oxygen consumption rate (OCR) quantification shows an increased OCR in midlife whole heads compared to young flies. Data were normalized to 1‐week‐old flies (young flies). N = 21 young vs. N = 24 midlife.
Metabolite levels show increased levels of acetyl‐CoA and citrate/isocitrate compound in midlife flies. N = 6 per group.
Enzymatic activity of citrate synthase and ATPCL is increased in midlife flies. CS, citrate synthase (Kdn); ATPCL, ATP citrate lyase. Data were normalized to young flies. N = 8 young vs. N = 9 midlife for CS and N = 6 young vs. N = 7 midlife for ATPCL.

Representative oxygen consumption rate profiles in young (blue circles) and old flies (black squares), showing lower consumption in the heads of 7‐week‐old flies. During an assay lasting 2 min, a series of 10 oxygen submeasurements (ticks) is taken. The slope of these 10 ticks is calculated to generate the oxygen consumption rate (OCR) measurement.
Representative oxygen consumption rate profiles in young (blue circles) and midlife flies (red squares), showing higher consumption in the heads of 4‐week‐old flies.
Negative control of wells containing buffer without any tissue. Background wells showed no changes in oxygen levels and served as background for all other measurements.
Oxygen levels during the first tick of each measurement series were similar in wells containing young and midlife male fly heads. The pH during the first tick was similar in the wells of the two groups. N = 21 young and N = 24 midlife.
Measurements of fly male heads show similar weight in young and midlife males. N = 6–7 per group.
Addition of 5 μM rotenone, a complex I inhibitor, significantly decreases oxygen consumption. This result demonstrates that the rate of oxygen consumption being measured relates to oxygen consumed by the respiratory complexes. Data were normalized to the data point before the addition of rotenone. Dashed line indicates addition of the drug.
Fly activity assay after 3 s. Distribution of flies across four sections of a vial following 3 s of flipping (Q4 is the section at the top of the vial). N = 7 young and N = 5 midlife.

Representative Western blot showing a mildly altered protein acetylation pattern (anti‐AcK) between 1‐week‐old (young) and 4‐week‐old (midlife) flies. Tubulin served as a loading control. N = 4–5 per group. Tub, Tubulin.
Heat map showing altered protein acetylation sites between young and midlife flies, based on the acetyl‐lysine‐enriched peptide fractions analyzed by MS and after normalization to protein input (detailed statistical method in extended Materials and Methods). N = 5 per group. fc, fold change.
The lysine deacetylase inhibitor (KDACi) sodium butyrate (SB) induces a rapid increase in oxygen consumption in the heads of young flies, but this increase is milder in midlife flies. The dashed line indicates the addition of SB. Data were normalized to the measurement prior to addition of SB (100%) and collected after five cycles of measurements, corresponding to approximately 33 min. N = 9 young vehicle, N = 8 young SB, N = 9 midlife vehicle, and N = 7 midlife SB. **P < 0.01, ***P < 0.001. Unpaired two‐tailed t‐tests were used for calculating the P‐values. Error bars indicate the SEM.
High sodium butyrate (SB)‐treated flies reach the end of the premortality plateau phase at earlier age of 11 days. Survival 90% control = 26 days, 15 mM SB = 24 days, 150 mM SB = 11 days. Median survival for control = 45 days, 15 mM SB = 41 days, 150 mM SB = 30. N = 357 (vehicle), 294 (15 mM SB), and 320 (150 mM SB). SB 15 mM log‐rank test, χ2 = 14.83, P = 0.0001. SB 150 mM log‐rank test, χ2 = 151.1, P < 0.0001.

Quantification of lysine acetylation levels by mass spectrometry (MS) reveals a general increase in protein acetylation in midlife flies. The box represents the interval that contains the central 50% of the data with the line indicating the median. The length of the whiskers is 1.5 times the interquartile distance (IQD).
Proteome analysis of the input samples by MS shows similar absolute levels for proteins involved in metabolic (in) and non‐metabolic (out) processes in 1‐week‐old (young) and 4‐week‐old (midlife) flies. The box represents the interval that contains the central 50% of the data with the line indicating the median. The length of the whiskers is 1.5 times the interquartile distance (IQD).
Proteome heat map comparing the protein intensities (see Proteome acetylation but not protein abundance increases as flies reach midlife) of the input. N = 5 per group. fc, fold change.
Trichostatin A (TSA) induces an increase in oxygen consumption in the heads of young flies. Data were normalized to the measurement prior to addition of TSA. N = 5 per group. Error bar indicates the SEM
400‐nM TSA‐treated male flies in mixed male/female population reach the end of the premortality plateau phase at a similar age of 4 weeks. However, 400‐nM TSA‐treated flies show reduced median and maximal life span. Survival for control = 53 days, 40 nM TSA = 47 days, 400 nM TSA = 45, N = 368 vehicle, 296 (40 nM TSA) and 326 (400 nM TSA). Log‐rank test of TSA40 nM, χ2 = 24.33, P < 0.0001. Log‐rank test of TSA400 nM, χ2 = 79.55, P < 0.0001.

Quantification of major acetylation sites on histones H3 and H4 in young and midlife flies. Midlife flies display a transformed histone acetylation profile including elevation (H4K12, H3K9, H3K9/14, and H3K23) and reduction (H4K8 and H3K18). Data were normalized to 1‐week‐old (young) flies. N = 15–22 (histone 4) and N = 12–19 (histone 3) per group.
Male flies show a gradual increased life span and prolonged premortality plateau phase at various length of exposure to 18°C (cold) compared to the 25°C (control) ambient temperature. Survival 90% control = 28 days, cold = 58 days. Median survival for control = 38 days, cold = 80 days. N = 295 (control) and 238 (cold). Log‐rank test, χ2 = 527.1, P < 0.0001.
Comparison of the activity of key metabolic enzymes between midlife flies grown at 18°C and 25°C. Midlife flies grown at 25°C have lower CS and ATPCL activity to midlife flies at 25°C. CS, citrate synthase; ATPCL, ATP citrate lyase. N = 9 midlife vs. N = 6 cold midlife for CS and N = 7 midlife vs. N = 6 cold midlife for ATPCL.
Metabolite levels show reduced levels of citrate and ATP in midlife flies at 18°C. The levels of acetyl‐CoA are not significantly different despite a trend of reduced levels in 18°C flies. N = 6 midlife vs. N = 5 cold midlife.
Midlife flies grown at 18°C show a general reduction in histone acetylation states including acetylation states which are increased upon aging (Fig 3A—H4K12, H3K9, H3K9/14 and H3K23). Of note, H4K8 is increased in midlife when flies are kept at 18°C. N = 16–21 (histone 4) and N = 13–16 (histone 3) per group.

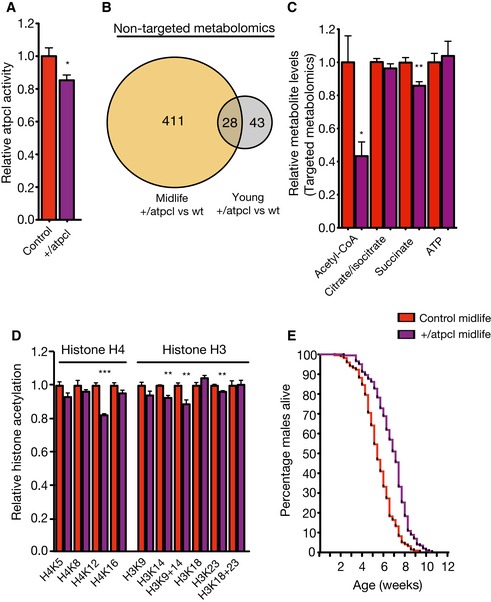
ATPCL mutant male flies show reduced ATPCL activity at their 4th week. N = 7 per group.
Non‐targeted metabolome reveals 71 significantly altered metabolites in young wild‐type vs. young +/atpcl mutants, while 439 metabolites are altered in the midlife groups out of 1,658 metabolite compounds. N = 6 per group.
Targeted metabolite measurements show decreased acetyl‐CoA and succinate in midlife +/atpcl mutants. N = 4–6 per measurement.
Quantification of histone H3 and H4 acetylation in +/atpcl mutants at 4 weeks of age (midlife). Age‐associated hyper‐acetylated histone states are reduced in +/atpcl mutant flies (H4K12, H3K14, H3K9/14 and H3K23). N = 5–6 per group.
+/atpcl male flies show an increased mean life span and slower mortality rates in midlife. Survival 90% control = 26 days, +/atpcl = 30 days, Median survival for control = 38 days, +/atpcl = 50 days. N = 220 (control) and 202 (+/atpcl). Log‐rank test, χ2 = 67.87, P < 0.0001.

The mutant atpcl allele we used (Bloomington 11055) consists of a P‐element insertion between the 5′ UTR of isoforms E/D and the 5′ UTR of isoforms F/G. RT–PCR reveals a 20% decrease in midlife atpcl heterozygote mutants (+/atpcl) compared to wild‐type control. N = 5–6 per group. Unpaired two‐tailed t‐tests were used for calculating the P‐values. *P < 0.05. Error bars indicate the SEM.
+/atpcl male flies in homogenous male population show increased mean life span and latency at arrival to accelerated population decline. Survival 90% control = 18 days, atpcl = 28 days. Median survival for control = 33 days, atpcl = 45 days, N = 198 (control) and 212 (Atpcl). Log‐rank test, χ2 =43.99. P < 0.0001. Unpaired two‐tailed t‐tests were used for calculating the P‐values.

The mutant chm allele we used removes the catalytic, histone acetyltransferase MYST domain spanning exons 8–10. N = 6–8 per group. ***P < 0.001. Unpaired two‐tailed t‐tests were used for calculating the P‐values.
Density plot showing decreased fold change of shared upregulated genes in chm mutants.
Chm male flies in homogenous male population show increased mean life span and latency at arrival to accelerated population decline. Survival 90% control = 25 days, chm = 41 days. Median survival for control = 50 days, chm = 56 days, N = 296 (control) and 318 (chm). Log‐rank test, χ2 = 36.83, P < 0.0001.
Fly activity assay after 8 s. Distribution of flies across five sections of a vial following 8 s of flipping (Q5 is the section at the top of the vial). N = 7.

The mutant chm allele we used removes the catalytic, histone acetyltransferase MYST domain. The chm mutants consistently display 50% mRNA reduction in young (7 days) and midlife (22 days) when compared to wild‐type flies. N = 5 young wt, N = 6 young chm mutants, N = 4 midlife wt, and N = 6 midlife chm mutants.
MS‐based quantification of histone H4 and H3 acetylation reveals a specific reduction in H4K12ac in male chm heterozygous mutants at 22 days of age (midlife). N = 7 per group.
RNA‐seq analysis reveals 1,758 significantly altered genes during wild‐type aging and 1,319 altered genes during chm aging process. A total of 920 genes are common to both aging processes. N = 5 young wt, 6 young chm mutants, 4 midlife wt, and 6 midlife chm mutants.
Shared age‐associated downregulated genes display similar fold change response in wild‐type and chm aging. In contrast, the upregulated genes display higher fold change in wild‐type aging compared with +/chm aging.
Chm male flies show increased mean life span and slower mortality rates in midlife. Survival 90% control = 20 days, chm = 22 days. Median survival for control = 34 days, chm = 42 days, N = 180 (control) and 175 (chm). Log‐rank test, χ2 = 37.15, P < 0.0001.
Midlife chm mutants display increased activity compared to midlife control N = 7.
Double chm/atpcl mutant displays similar life span to +/atpcl mutant. Survival 90% +/atpcl = 39 days, chm/atpcl = 35 days. Median survival for +/atpcl = 57 days, chm/atpcl = 54 days, N = 256 (+/atpcl) and 301 (chm/atpcl). Log‐rank test, χ2 = 3.19.

References
-
- Trifunovic A, Wredenberg A, Falkenberg M, Spelbrink JN, Rovio AT, Bruder CE, Bohlooly‐Y M, Gidlöf S, Oldfors A, Wibom R et al (2004) Premature ageing in mice expressing defective mitochondrial DNA polymerase. Nature 429: 417–423 - PubMed
-
- Dillin A, Hsu A‐L, Arantes‐Oliveira N, Lehrer‐Graiwer J, Hsin H, Fraser AG, Kamath RS, Ahringer J, Kenyon C (2002) Rates of behavior and aging specified by mitochondrial function during development. Science 298: 2398–2401 - PubMed
-
- Weindruch R, Walford RL, Fligiel S, Guthrie D (1986) The retardation of aging in mice by dietary restriction: longevity, cancer, immunity and lifetime energy intake. J Nutr 116: 641–654 - PubMed
Publication types
MeSH terms
Substances
Grants and funding
LinkOut - more resources
Full Text Sources
Other Literature Sources
Molecular Biology Databases
