

Genomic-assisted haplotype analysis and the development of high-throughput SNP markers for salinity tolerance in soybean
- PMID: 26781337
- PMCID: PMC4726057
- DOI: 10.1038/srep19199
Genomic-assisted haplotype analysis and the development of high-throughput SNP markers for salinity tolerance in soybean
Abstract
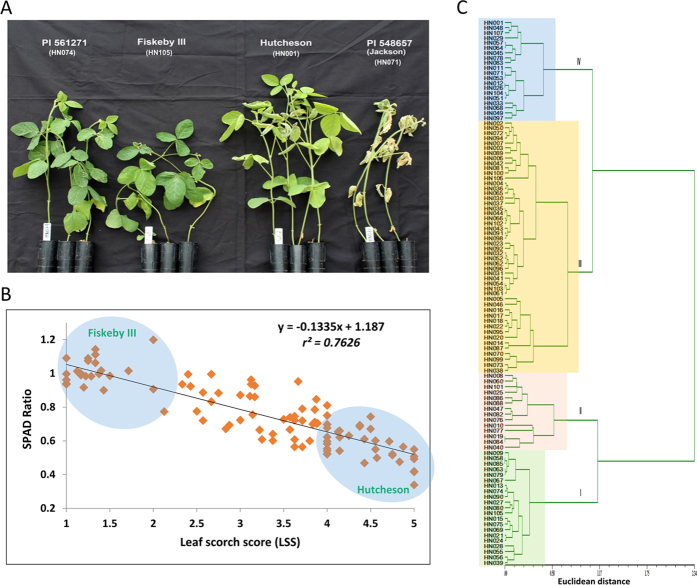
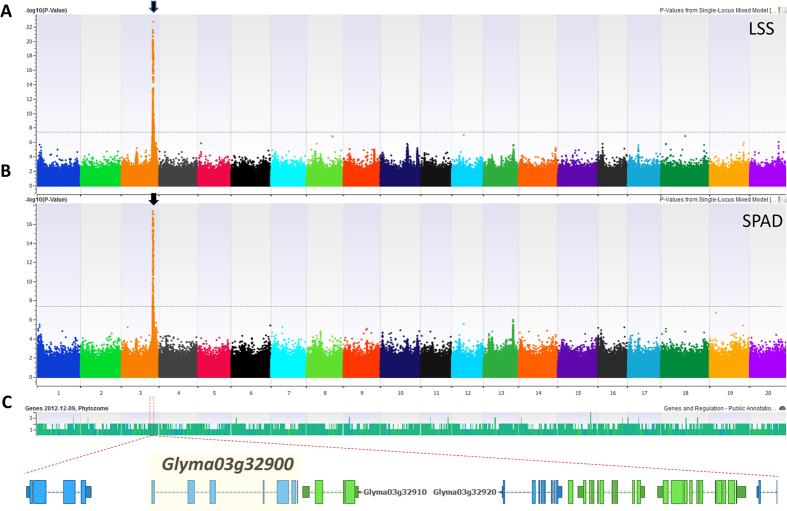
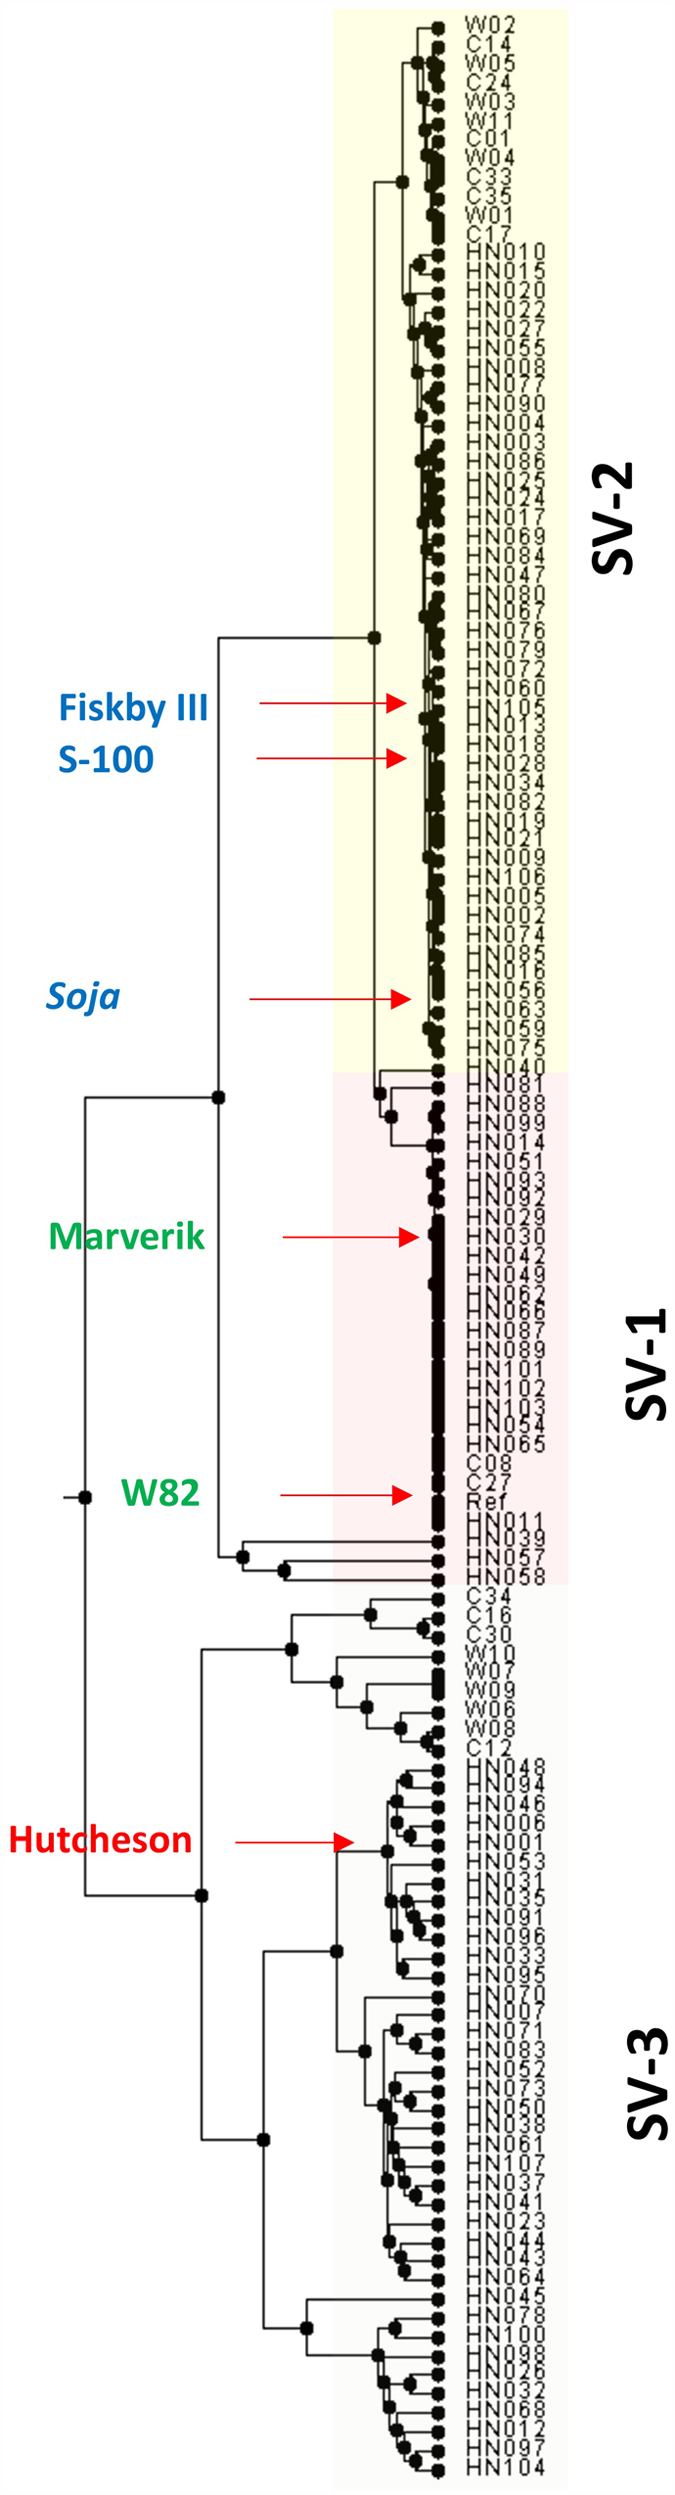
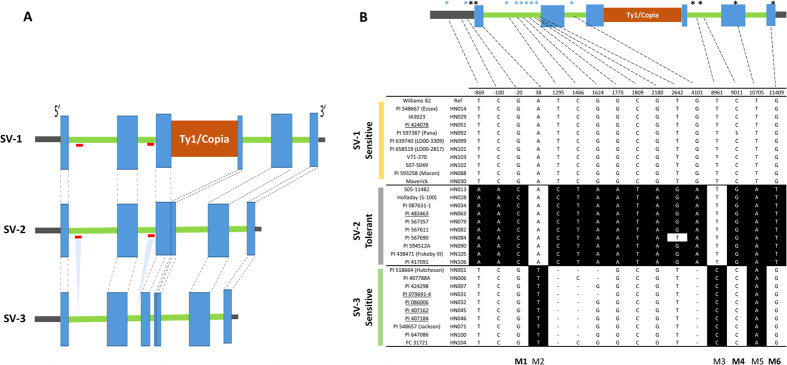
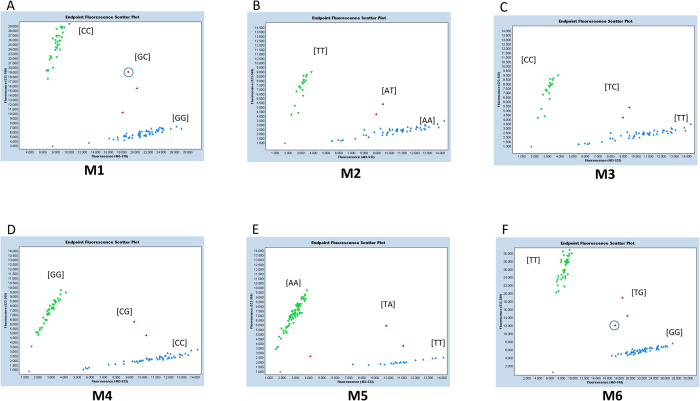
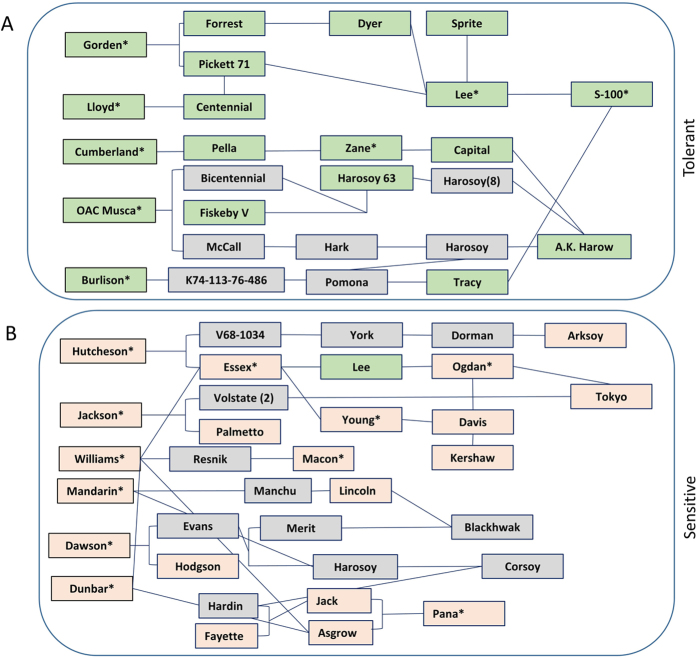
Soil salinity is a limiting factor of crop yield. The soybean is sensitive to soil salinity, and a dominant gene, Glyma03g32900 is primarily responsible for salt-tolerance. The identification of high throughput and robust markers as well as the deployment of salt-tolerant cultivars are effective approaches to minimize yield loss under saline conditions. We utilized high quality (15x) whole-genome resequencing (WGRS) on 106 diverse soybean lines and identified three major structural variants and allelic variation in the promoter and genic regions of the GmCHX1 gene. The discovery of single nucleotide polymorphisms (SNPs) associated with structural variants facilitated the design of six KASPar assays. Additionally, haplotype analysis and pedigree tracking of 93 U.S. ancestral lines were performed using publically available WGRS datasets. Identified SNP markers were validated, and a strong correlation was observed between the genotype and salt treatment phenotype (leaf scorch, chlorophyll content and Na(+) accumulation) using a panel of 104 soybean lines and, an interspecific bi-parental population (F8) from PI483463 x Hutcheson. These markers precisely identified salt-tolerant/sensitive genotypes (>91%), and different structural-variants (>98%). These SNP assays, supported by accurate phenotyping, haplotype analyses and pedigree tracking information, will accelerate marker-assisted selection programs to enhance the development of salt-tolerant soybean cultivars.
Figures
Similar articles
-
Identification of new loci for salt tolerance in soybean by high-resolution genome-wide association mapping.BMC Genomics. 2019 Apr 25;20(1):318. doi: 10.1186/s12864-019-5662-9. BMC Genomics. 2019. PMID: 31023240 Free PMC article.
-
A novel natural variation in the promoter of GmCHX1 regulates conditional gene expression to improve salt tolerance in soybean.J Exp Bot. 2024 Feb 2;75(3):1051-1062. doi: 10.1093/jxb/erad404. J Exp Bot. 2024. PMID: 37864556 Free PMC article.
-
Deciphering the genetic basis of salinity tolerance in a diverse panel of cultivated and wild soybean accessions by genome-wide association mapping.Theor Appl Genet. 2024 Sep 28;137(10):238. doi: 10.1007/s00122-024-04752-4. Theor Appl Genet. 2024. PMID: 39342026 Free PMC article.
-
Research progress on identification of QTLs and functional genes involved in salt tolerance in soybean.Yi Chuan. 2016 Nov 20;38(11):992-1003. doi: 10.16288/j.yczz.16-086. Yi Chuan. 2016. PMID: 27867149 Review.
-
Genetic and Genomic Resources for Soybean Breeding Research.Plants (Basel). 2022 Apr 27;11(9):1181. doi: 10.3390/plants11091181. Plants (Basel). 2022. PMID: 35567182 Free PMC article. Review.
Cited by
-
Recent advancement in OMICS approaches to enhance abiotic stress tolerance in legumes.Front Plant Sci. 2022 Sep 28;13:952759. doi: 10.3389/fpls.2022.952759. eCollection 2022. Front Plant Sci. 2022. PMID: 36247536 Free PMC article. Review.
-
The Soybean Gene J Contributes to Salt Stress Tolerance by Up-Regulating Salt-Responsive Genes.Front Plant Sci. 2020 Mar 17;11:272. doi: 10.3389/fpls.2020.00272. eCollection 2020. Front Plant Sci. 2020. PMID: 32256507 Free PMC article.
-
Generating High Density, Low Cost Genotype Data in Soybean [Glycine max (L.) Merr.].G3 (Bethesda). 2019 Jul 9;9(7):2153-2160. doi: 10.1534/g3.119.400093. G3 (Bethesda). 2019. PMID: 31072870 Free PMC article.
-
Pinpointing Genomic Regions and Candidate Genes Associated with Seed Oil and Protein Content in Soybean through an Integrative Transcriptomic and QTL Meta-Analysis.Cells. 2022 Dec 26;12(1):97. doi: 10.3390/cells12010097. Cells. 2022. PMID: 36611890 Free PMC article.
-
Advances in Omics Approaches for Abiotic Stress Tolerance in Tomato.Biology (Basel). 2019 Nov 25;8(4):90. doi: 10.3390/biology8040090. Biology (Basel). 2019. PMID: 31775241 Free PMC article. Review.
References
-
- Sairam R. K. & Tyagi A. Physiology and molecular biology of salinity stress tolerance in plants. Curr Sci 86, 407–421 (2004).
-
- Yamaguchi T. & Blumwald E. Developing salt-tolerant crop plants: challenges and opportunities. Trends Plant Sci 10, 615–620 (2005). - PubMed
-
- Tuyen D. D., Lal S. K. & Xu D. H. Identification of a major QTL allele from wild soybean (Glycine soja Sieb. & Zucc.) for increasing alkaline salt tolerance in soybean. Theor Appl Genet 121, 229–236 (2010). - PubMed
-
- Chinnusamy V., Jagendorf A. & Zhu J. K. Understanding and improving salt tolerance in plants. Crop Sci 45, 437–448 (2005).
Publication types
MeSH terms
Substances
LinkOut - more resources
Full Text Sources
Other Literature Sources
Miscellaneous
