Review
doi: 10.5152/dir.2015.15286.
Invisible fat on CT: making it visible by MRI
Affiliations
- PMID: 26782156
- PMCID: PMC4790064
- DOI: 10.5152/dir.2015.15286
Item in Clipboard
Review
Invisible fat on CT: making it visible by MRI
Diagn Interv Radiol.
2016 Mar-Apr.
Abstract
Presence of fat in a lesion significantly narrows the differential diagnosis. Small quantities of macroscopic fat and intracellular fat are invisible on computed tomography (CT) and ultrasonography. Magnetic resonance imaging (MRI) can reveal any fatty change in a lesion and can also differentiate macroscopic fat from intracellular and intravoxel fat. Hypodensity on CT may be a sign of invisible fat and MRI can help to diagnose even minute amounts of fat in liver, pancreas, adrenal, musculoskeletal, and omental pseudolesions and lesions. This article will review the superiority of MRI over CT in demonstrating fat in abdominal lesions.
Figures
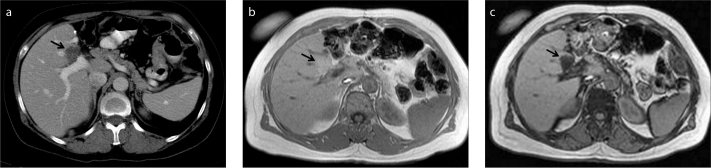
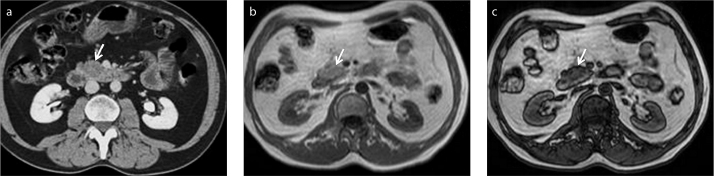
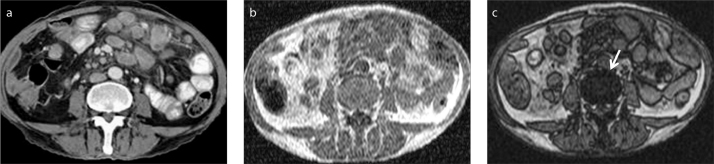
a–c. A 50-year-old female patient with gastric carcinoma. Follow-up contrast-enhanced axial CT image (a) shows a new hypodense lesion (arrow) suspicious for metastasis in a typical location for focal fat. In-phase (b) and opposed-phase (c) MRI demonstrate fat content (arrow) that is invisible on CT.
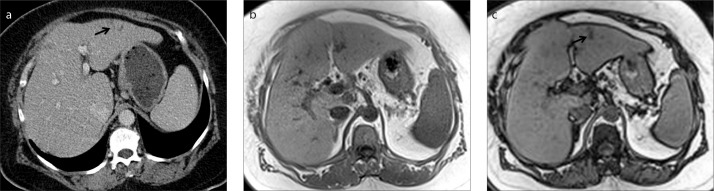
a–c. A 64-year-old female patient with colon carcinoma. Contrast-enhanced axial CT image (a) shows a new nonspecific hypodense lesion (arrow) in left lobe of the liver. In-phase (b) and opposed-phase (c) MRI demonstrate focal fat infiltration (arrow) invisible on CT.
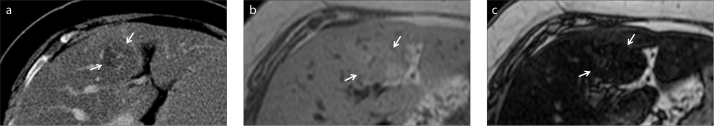
a–c. A 68-year-old female patient with breast carcinoma. Contrast-enhanced axial CT image (a) shows a new hypodense lesion (arrows) thought to be a metastasis in a steatotic liver. In-phase (b) and opposed-phase (c) MRI reveal liver steatosis along with focal hypersteatosis (arrows).
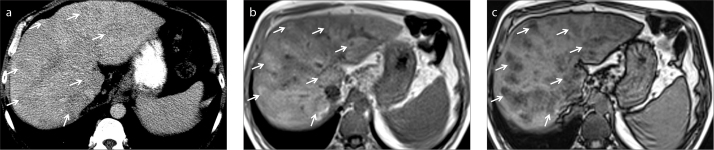
a–c. A 50-year-old male patient with elevated liver enzymes. Unenhanced axial CT image (a) shows subtle parenchymal heterogeneity due to nonspecific hypodense areas (arrows). In-phase (b) and opposed-phase (c) MRI demonstrate perivenous fat infiltration (arrows) that is not visible on CT.
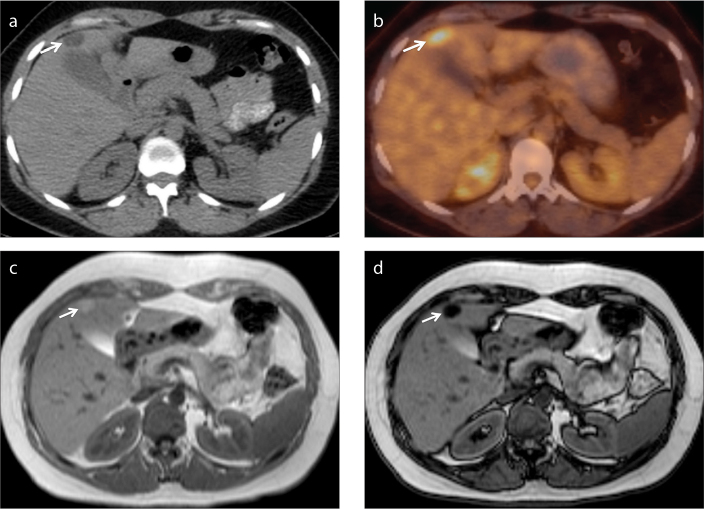
a–d. A 52-year-old female patient with renal cell carcinoma who underwent left partial nephrectomy. Axial PET-CT image (a) shows a hypodense nodular lesion (arrow) adjacent to gallbladder, with increased FDG uptake (b,
arrow), suspicious for metastasis. Lipid-rich hepatic adenoma is diagnosed by demonstration of fat on in-phase (c) and opposed-phase (d) MRI (arrow).
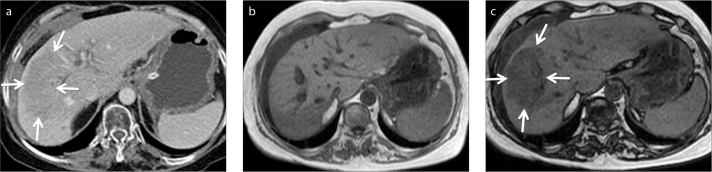
a–c. A 60-year-old female patient with right portal vein thrombosis. Contrast-enhanced axial CT image (a) shows parenchymal hypodensity (arrows) suspicious for a mass. In-phase (b) and opposed-phase (c) MRI demonstrate focal fat infiltration area (arrows).
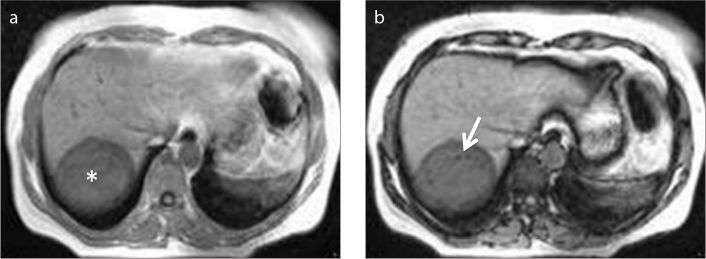
a, b. A 30-year-old female patient with hydatid cyst of the liver (asterisk). Opposed-phase MRI (b) shows fat droplets (arrow) within the cyst lumen as a result of biliary communication.
a–c. A 64-year-old male patient with metastatic hepatocellular carcinoma. Contrast-enhanced axial CT image (a) shows a heterogeneous left adrenal mass (arrow). In-phase (b) and opposed-phase (c) MRI reveals fat content of the mass (arrow), which was also seen in the primary tumor (not shown).
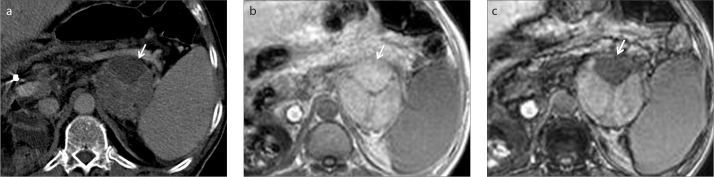
a–c. A 54-year-old male patient with a suspicious pancreatic mass. Contrast-enhanced axial CT image (a) shows a hypodense lesion (arrow) in uncinate process of the pancreas thought to be malignant. No discrete lesion is seen on in-phase MRI (b,
arrow). Focal fatty infiltration of the pancreas is revealed by decreasing signal intensity on opposed-phase image (c,
arrow).
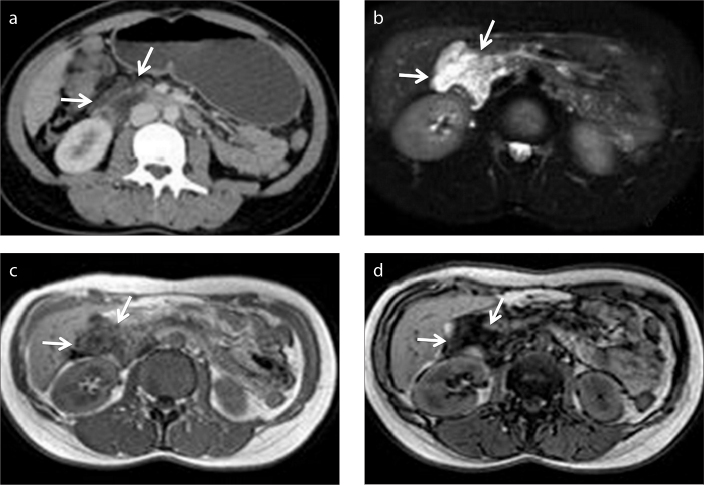
a–d. A 38-year-old female patient with an incidentally detected peripancreatic mass. Contrast-enhanced axial CT image (a) shows a probably benign yet nonspecific cystic mass (arrows) adjacent to the head of the pancreas. Further characterization is limited on CT. Axial fat-suppressed T2-weighted image (b) clearly depicts cystic nature of the mass (arrows). In-phase (c) and opposed-phase (d) MRI demonstrate fat content of the mass (arrows), so that diagnosis of a peripancreatic lymphangioma can be made.
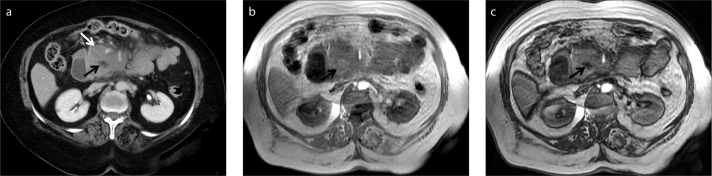
a–c. A 72-year-old previously healthy female patient with a pancreatic mass. Contrast-enhanced axial CT image (a) demonstrates a mass involving the uncinate process of the pancreas (white arrow). Lack of vascular invasion is noted. A nonspecific hypodense lesion within the mass is also noted (black arrow) which is atypical for necrotic content. No further characterization can be made on CT. In-phase (b) and opposed-phase (c) MRI depicts fat (black arrows) within the mass. Diagnosis of pancreatic lymphoma was made histopathologically. Encasement rather than invasion of fat and vessels adjacent to mass, as well as lack of pancreatic duct dilatation are the clues for diagnosis.
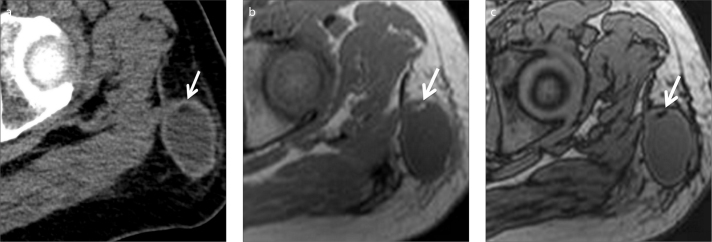
a–c. A 49-year-old male patient with gastric carcinoma. Follow-up contrast-enhanced axial CT image (a) shows a new subcutaneous mass in the left upper thigh. Suspicious hypodensity thought to represent fat is also noted (arrow). In-phase (b) and opposed-phase (c) MRI clearly show fat content (arrows). Thus, diagnosis of Morel-Lavallée lesion can be made in a patient with a history of recent trauma.
a–c. Conversion of red marrow to yellow (lipid rich) marrow. Contrast-enhanced axial CT image (a) shows a normal vertebral body. In-phase (b) and opposed-phase (c) MRI show signal drop (arrow) due to lipid content of yellow marrow. Preservation of signal drop excludes bone marrow infiltration.
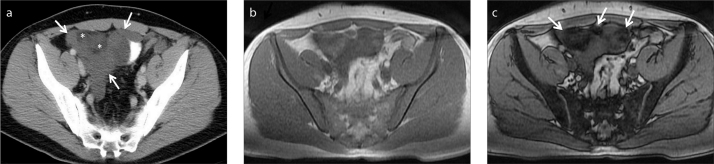
a–c. A 32-year-old male patient with myxoid liposarcoma metastatic to peritoneal space. Contrast-enhanced axial CT image (a) demonstrates more specifically the cystic nature (lower attenuation than muscle) and extension of the mass (arrows). There is a suspicion of fat contents which are barely seen (asterisks). Therefore, initial differential diagnosis is limited to cystic peritoneal masses. However crucial imaging finding was fat content of the mass, which was indistinct on CT. Fat content of the liposarcoma is revealed on in-phase (b) and opposed-phase (c) MRI (arrows).
References
-
- Holalkere NS, Sahani DV, Blake MA, Halpern EF, Hahn PF, Mueller PR. Characterization of small liver lesions: Added role of MR after MDCT. J Comput Assist Tomogr. 2006;30:591–596. http://dx.doi.org/10.1097/00004728-200607000-00007. - DOI - PubMed
-
- Mueller GC, Hussain HK, Carlos RC, Nghiem HV, Francis IR. Effectiveness of MR imaging in characterizing small hepatic lesions: routine versus expert interpretation. AJR Am J Roentgenol. 2003;180:673–680. http://dx.doi.org/10.2214/ajr.180.3.1800673. - DOI - PubMed
-
- Bottcher J, Hansch A, Pfeil A, et al. Detection and classification of different liver lesions: comparison of Gd-EOB-DTPA-enhanced MRI versus multiphasic spiral CT in a clinical single centre investigation. Eur J Radiol. 2013;82:1860–1869. http://dx.doi.org/10.1016/j.ejrad.2013.06.013. - DOI - PubMed
-
- Schwartz LH, Gandras EJ, Colangelo SM, Ercolani MC, Panicek DM. Prevalence and importance of small hepatic lesions found at CT in patients with cancer. Radiology. 1999;210:71–74. http://dx.doi.org/10.1148/radiology.210.1.r99ja0371. - DOI - PubMed
-
- Delfaut EM, Beltran J, Johnson G, Rousseau J, Marchandise X, Cotten A. Fat suppression in MR imaging: techniques and pitfalls. Radiographics. 1999;19:373–382. http://dx.doi.org/10.1148/radiographics.19.2.g99mr03373. - DOI - PubMed
Publication types
MeSH terms
LinkOut - more resources
Full Text Sources
Other Literature Sources
Medical