. 2016:876:111-120.
doi: 10.1007/978-1-4939-3023-4_14.

Simulation of Preterm Neonatal Brain Metabolism During Functional Neuronal Activation Using a Computational Model

Affiliations

Simulation of Preterm Neonatal Brain Metabolism During Functional Neuronal Activation Using a Computational Model

T Hapuarachchi et al. Adv Exp Med Biol. 2016.

Erratum in

  • Erratum.
    Elwell CE, Leung TS, Harrison DK. Elwell CE, et al. Adv Exp Med Biol. 2016;876:E1-E2. doi: 10.1007/978-1-4939-3023-4_66. Adv Exp Med Biol. 2016. PMID: 27785776 Free PMC article. No abstract available.

Abstract

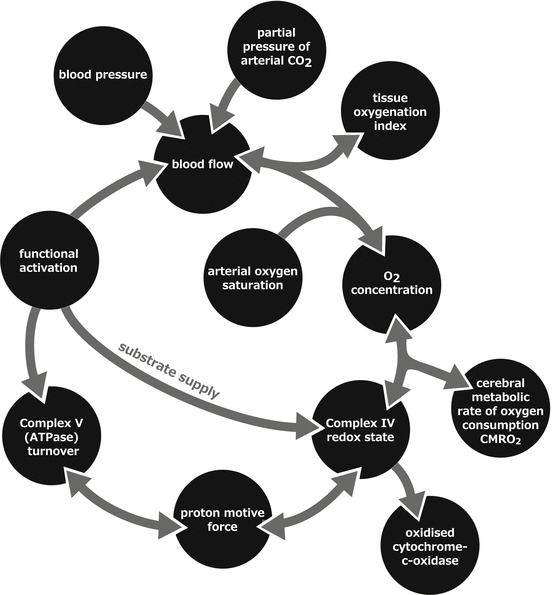
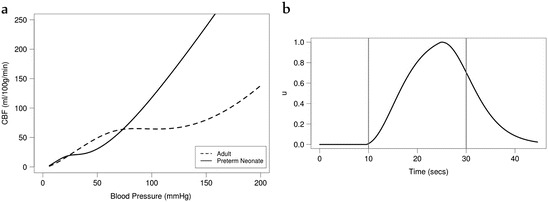
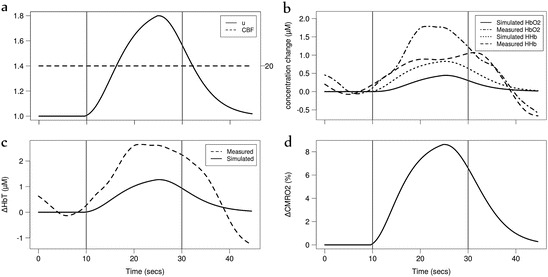
We present a computational model of metabolism in the preterm neonatal brain. The model has the capacity to mimic haemodynamic and metabolic changes during functional activation and simulate functional near-infrared spectroscopy (fNIRS) data. As an initial test of the model's efficacy, we simulate data obtained from published studies investigating functional activity in preterm neonates. In addition we simulated recently collected data from preterm neonates during visual activation. The model is well able to predict the haemodynamic and metabolic changes from these observations. In particular, we found that changes in cerebral blood flow and blood pressure may account for the observed variability of the magnitude and sign of stimulus-evoked haemodynamic changes reported in preterm infants.

Keywords: Autoregulation; Haemodynamics; Mathematical model; Stimulus – evoked functional response; fNIRS.


Figures

Fig. 14.1
Fig. 14.1
A simple schematic of the model. Model inputs are blood pressure, arterial oxygenation saturation, partial pressure of arterial carbon dioxide and functional activation
Fig. 14.2
Fig. 14.2
(a) Autoregulation curve—cerebral blood flow (CBF) against blood pressure—for the adult BrainSignals model and the preterm neonate model. (b) Demand as a model input, using a haemodynamic response function, to simulate functional activation
Fig. 14.3
Fig. 14.3
Model simulated and observed haemodynamic response of the Kozberg et al. study [12], investigating functional response in rats, with an increase in demand and blood pressure (BP). (a) Changes in deoxy- and oxy- haemoglobin (HHb, HbO2) concentrations. (b) Changes in BP and total haemoglobin (HbT)
Fig. 14.4
Fig. 14.4
Model simulated and observed haemodynamic response of the Kozberg et al. study [12], investigating functional response in rats, with a slight decrease in arterial radius and blood pressure (BP). (a) Changes in deoxy- and oxy- haemoglobin (HHb, HbO2) concentrations. (b) Changes in BP and total haemoglobin (HbT)
Fig. 14.5
Fig. 14.5
Model simulated and observed haemodynamic response of the Roche-Labarbe et al. study [13], investigating functional response in human preterm neonates, with an increase in demand. (a) Relative changes in oxy- and deoxy- haemoglobin (rHbO2, rHHb), (b) cerebral blood volume (rCBV) and cerebral blood flow (rCBF) and (c) cerebral metabolic rate of oxygen consumption (rCMRO2)
Fig. 14.6
Fig. 14.6
Model simulation of Neonate 1 of the USZ study. Simulated haemodynamic response with (a) an increase in demand u. Vertical lines indicate stimulus period. Measured and simulated changes in (b) oxy- and deoxy- haemoglobin (ΔHbO2, ΔHHb) and (c) total haemoglobin (ΔHbT). (d) Simulated cerebral metabolic rate of oxygen consumption (CMRO2) cerebral blood flow (CBF)
Fig. 14.7
Fig. 14.7
Model simulation of Neonate 2 of the USZ study. Simulated haemodynamic response with (a) an increase in demand u and CBF maintained constant. Vertical lines indicate stimulus period. Measured and simulated changes in (b) oxy- and deoxy- haemoglobin (ΔHbO2, ΔHHb) and (c) total haemoglobin (ΔHbT). (d) Simulated cerebral metabolic rate of oxygen consumption (CMRO2)

References

    1. Banaji M, Mallet A, Elwell CE, et al. A model of brain circulation and metabolism: NIRS signal changes during physiological challenges. PLoS Comput Biol. 2008;4(11):e1000212. doi: 10.1371/journal.pcbi.1000212. - DOI - PMC - PubMed
    1. Moroz T, Banaji M, Robertson NJ, et al. Computational modelling of the piglet brain to simulate near-infrared spectroscopy and magnetic resonance spectroscopy data collected during oxygen deprivation. J R Soc Interface. 2012;9(72):1499–1509. doi: 10.1098/rsif.2011.0766. - DOI - PMC - PubMed
    1. Greisen G. Cerebral blood flow in preterm infants during the first week of life. Acta Paediatr Scand. 1986;75(1):43–51. doi: 10.1111/j.1651-2227.1986.tb10155.x. - DOI - PubMed
    1. Cooper CE, Springett R. Measurement of cytochrome oxidase and mitochondrial energetics by near-infrared spectroscopy. Phil Trans R Soc Lond B. 1997;352:669–676. doi: 10.1098/rstb.1997.0048. - DOI - PMC - PubMed
    1. Springett R, Newman J, Cope M, et al. Oxygen dependency and precision of cytochrome oxidase signal from full spectral NIRS of the piglet brain. Am J Physiol Heart Circ Physiol. 2000;279:H2202–H2209. - PubMed

Publication types