. 2016 Jan 18:11:1.
doi: 10.1186/s13064-015-0056-4.

Microtubule-associated protein 1b is required for shaping the neural tube

Affiliations

Microtubule-associated protein 1b is required for shaping the neural tube

Pradeepa Jayachandran et al. Neural Dev. .

Abstract

Background: Shaping of the neural tube, the precursor of the brain and spinal cord, involves narrowing and elongation of the neural tissue, concomitantly with other morphogenetic changes that contribue to this process. In zebrafish, medial displacement of neural cells (neural convergence or NC), which drives the infolding and narrowing of the neural ectoderm, is mediated by polarized migration and cell elongation towards the dorsal midline. Failure to undergo proper NC results in severe neural tube defects, yet the molecular underpinnings of this process remain poorly understood.

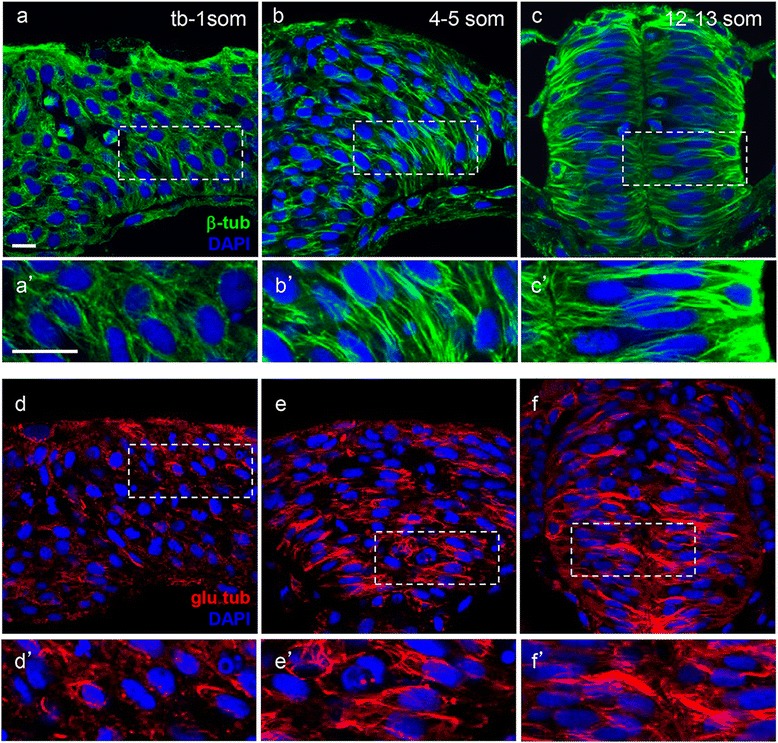
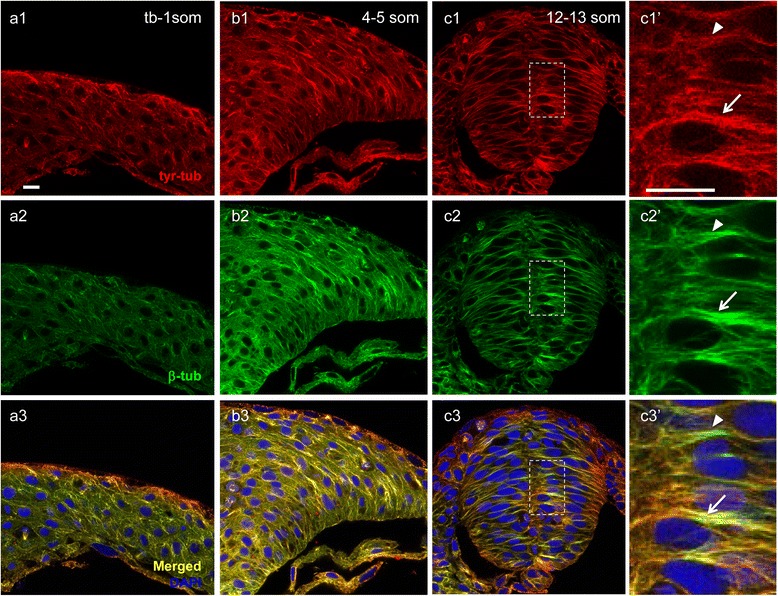
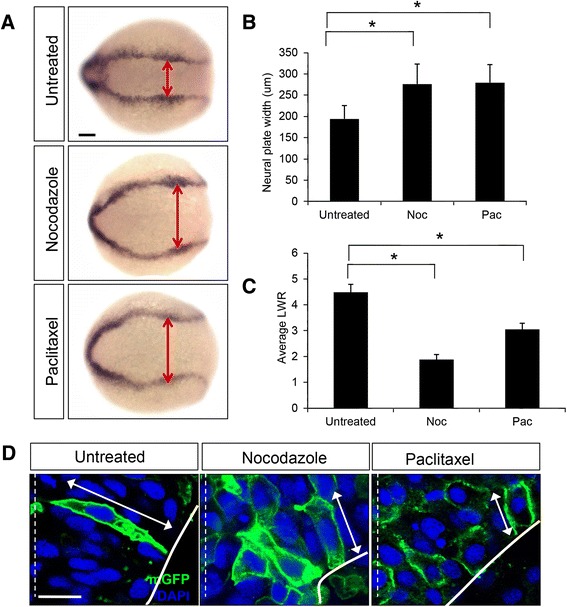
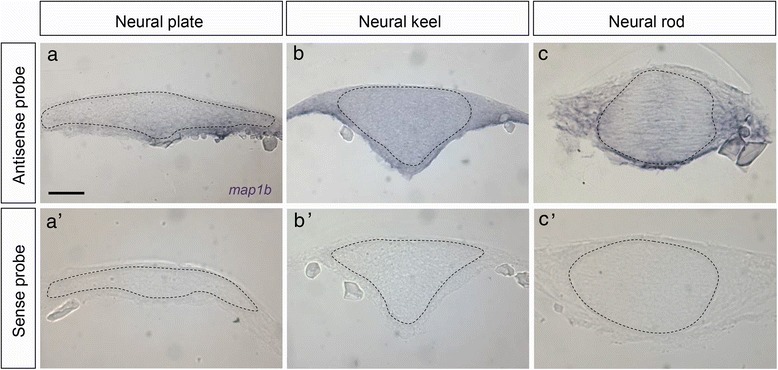
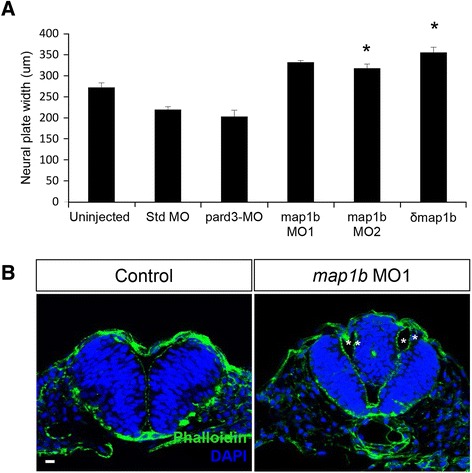
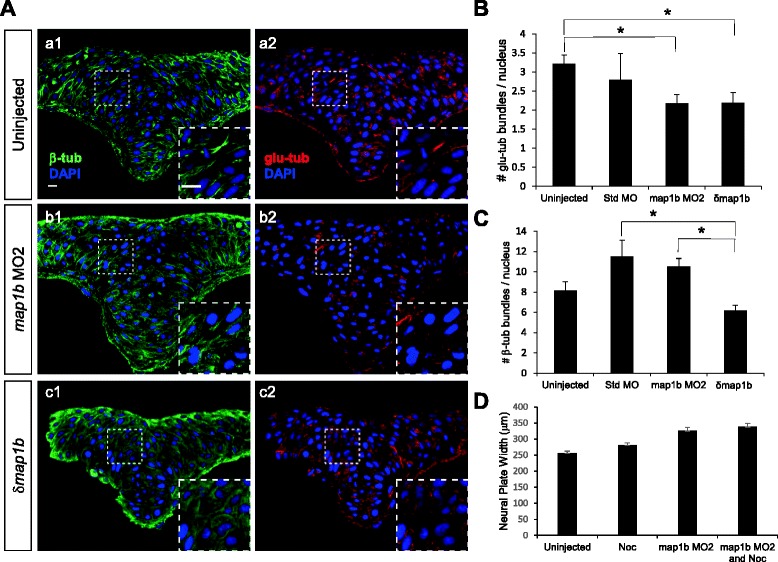
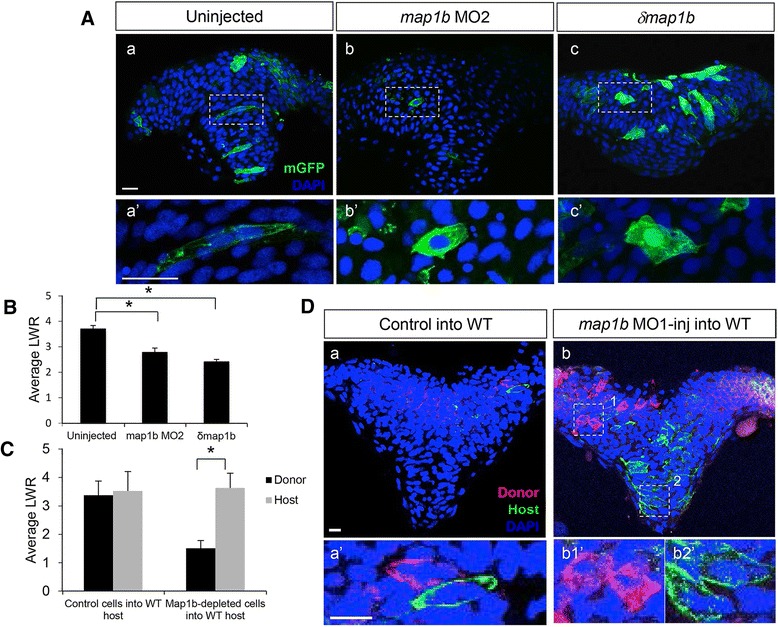
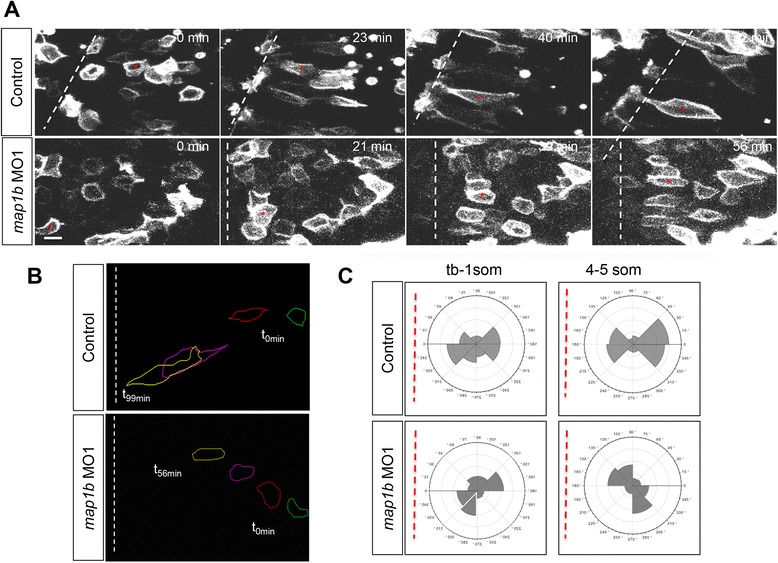
Results: We investigated here the role of the microtubule (MT) cytoskeleton in mediating NC in zebrafish embryos using the MT destabilizing and hyperstabilizing drugs nocodazole and paclitaxel respectively. We found that MTs undergo major changes in organization and stability during neurulation and are required for the timely completion of NC by promoting cell elongation and polarity. We next examined the role of Microtubule-associated protein 1B (Map1b), previously shown to promote MT dynamicity in axons. map1b is expressed earlier than previously reported, in the developing neural tube and underlying mesoderm. Loss of Map1b function using morpholinos (MOs) or δMap1b (encoding a truncated Map1b protein product) resulted in delayed NC and duplication of the neural tube, a defect associated with impaired NC. We observed a loss of stable MTs in these embryos that is likely to contribute to the NC defect. Lastly, we found that Map1b mediates cell elongation in a cell autonomous manner and polarized protrusive activity, two cell behaviors that underlie NC and are MT-dependent.

Conclusions: Together, these data highlight the importance of MTs in the early morphogenetic movements that shape the neural tube and reveal a novel role for the MT regulator Map1b in mediating cell elongation and polarized cell movement in neural progenitor cells.


Figures

Fig. 1
Fig. 1
Microtubules become increasingly stabilized during neurulation. Hindbrain sections of embryos at the neural plate (tb-1 som) (a, a’, d, d’), neural keel (4–5 som) (b, b’, e, e’) and neural rod (12–13 som) (c, c’, f, f’) stages immunolabeled with anti-β-tub (total MTs) in green (ac’) and anti-glu-tub (detyrosinated MTs) in red (df’). (a’c’) and (d’f’) Higher magnification of boxed areas in (ac) and (df), respectively. Scale bars: 10 μm
Fig. 2
Fig. 2
Distribution of dynamic microtubules during neurulation. Hindbrain sections of embryos at the neural plate (tb-1 som) (a1a3), neural keel (4–5 som) (b1b3) and neural rod (12–13 som) (c1c3’) stages immunolabeled with anti-tyr-tub (dynamic MTs) in red (a1, b1, c1, c1’), anti-β-tub (total MTs) in green (a2, b2, c2, c2’). (a3, b3, c3, c3’) Red-Green overlay (yellow) of images in (a1-c2’) with nuclei labeled in blue using DAPI. (c1’-c3’) Higher magnification of boxed areas in (c1c3). Arrows indicate high overlap between anti-tyr-tub and anti-β-tub; arrowheads indicate area of reduced overlap between these two markers. Scale bars: 10 μm
Fig. 3
Fig. 3
Regulation of microtubule dynamics is required for NC. a Dorsal views of untreated, nocodazole-treated (5 μg/ml) and paclitaxel-treated (50 μM) embryos labeled by in situ hybridization with the dlx3 riboprobe. Double red arrowheads indicate the width of the neural plate. Scale bar: 100 μm . b Quantification of the neural plate width (μm) in control (untreated) and drug-treated embryos. (*) indicates statistical significance (P <0.001 for untreated vs nocodazole and untreated vs paclitaxel) using a Kruskal-Wallis test followed by Dunn’s post-hoc test. c Quantification of the length-to-width (LWR) ratio of mGFP-labeled cells in control (untreated), nocodazole-treated, and paclitaxel-treated embryos at the 4–5 som stage. (*) indicates statistical significance (P <0.001 for untreated vs nocodazole and P <0.01 for untreated vs paclitaxel) using a Kruskal-Wallis test followed by Dunn’s post-hoc test. d Hindbrain sections of 4–5 som control (untreated), nocodazole-treated and paclitaxel-treated embryos mosaically expressing mGFP (green). Nuclei are labeled in blue with DAPI. Double arrows indicate cell length. The dotted white line represents the midline. Scale bar: 10 μm
Fig. 4
Fig. 4
map1b mRNA distribution. Expression of map1b mRNA in hindbrain sections detected by in situ hybridization using anti-sense (a, b and c) or sense (a’, b’ and c’) probes. (a, a’) neural plate, (b, b’) neural keel, (c, c’) neural rod stage embryos. The neural tissue is delineated by a dotted line. Scale bar: 20 μm
Fig. 5
Fig. 5
map1b depletion causes NC defects. a Quantification of the width of the neural plate (μm). (*) Indicates statistical significance (P <0.01 for uninjected vs map1b MO2; P <0.001 for uninjected vs δmap1b-injected) using a Kruskal-Wallis test followed by Dunn’s post-hoc test. b Hindbrain sections of uninjected and map1b MO1-injected embryos at 24hpf, labeled with Phalloidin (cortical actin, green) and DAPI (nuclei, blue). Asterisks indicate the ventricles of the duplicated neural tube. Scale bar: 10 μm
Fig. 6
Fig. 6
Microtubule stability is altered in Map1b-depleted embryos. a Hindbrain sections of uninjected (a1, a2), map1b MO2-injected (b1, b2) and δmap1b-injected (c1, c2) embryos at 4–5 som immunolabeled with anti-β-tub (green, a1, b1, c1) and anti-glu-tub (red, a2, b2, c2). Nuclei are labeled in blue with DAPI. Insets show higher magnification of boxed areas. Scale bars: 10 μm. b Quantification of the average number of glu-tub - labeled bundles per nucleus in uninjected, standard MO-injected, map1b MO2-injected and δmap1b-injected embryos. (*) Indicates statistical significance (P <0.05 for uninjected vs map1b MO2 and P <0.05 for uninjected vs δmap1b-injected) using ANOVA followed by a Bonferroni post test. c Quantification of the average number of β-tub labeled bundles per nucleus in uninjected, standard MO-injected, map1b MO2-injected and δmap1b-injected embryos. (*) Indicates statistical significance (P <0.01 for standard MO vs δmap1b-injected) using ANOVA followed by a Bonferroni post test (d) Quantification of the neural plate width in control (uninjected), map1b MO2-injected embryos, nocodazole (3 μΜ)-treated embryos, and map1b MO1-injected embryos treated with nocodazole
Fig. 7
Fig. 7
Map1b functions cell autonomously in the neural ectoderm. a Hindbrain sections of 4–5 som uninjected (a, a’), map1b MO2-injected (b, b’) and δmap1b-injected (c, c’) embryos mosaically-expressing mGFP (green). Nuclei are labeled in blue with DAPI. (a’–c’) Higher magnification of boxed areas in (a–c) respectively. Scale bars: 20 μm. b Quantification of the LWR of cells in 4–5 som uninjected, map1b MO2-injected and δmap1b-injected embryos. (*) Indicates statistical significance (P <0.01 for uninjected vs map1b MO2 and P <0.001 for uninjected vs δmap1b-injected) using a Kruskal-Wallis test followed by Dunn’s post-hoc test. c Quantification of the LWR of control donor cells vs host WT cells and map1b MO1-injected donor cells vs host WT cells. (*) Indicates statistical significance (P <0.0001) using Student’s T-test. d Hindbrain sections of 4–5 som WT hosts mosaically-expressing mGFP and transplanted with (a) mRFP-labeled control donor cells or (b) mRFP-labeled map1b-MO1 donor cells. Nuclei are labeled with DAPI (blue). (a’, b1’ and b2’) Higher magnifications of boxed areas in (a, b1 and b2) respectively. Scale bars: 10 μm
Fig. 8
Fig. 8
Polarized migration is disrupted in Map1b-depleted embryos. a Selected frames from time-lapse imaging of control (uninjected) and map1b-depleted mGFP-expressing cells in the neural plate. The white dotted line indicates the dorsal midline, when visible in the imaging field. Time elapsed (minutes) is indicated in the upper right corner. Red asterisks indicate individual cells identified in multiple frames. Scale bar: 10 μm. b Representative traces of control and map1b-depleted cells traced over time. Traces corresponding to time 0 (t0 min, green) are to the right and traces of older cells (t56 min and higher, yellow) are to the left. c Plot of the average distribution of membrane protrusions in representative mGFP- labeled control and map1b-depleted cells at the neural plate stage. The red dotted line represents the position of the dorsal midline

References

    1. Davidson LA, Keller RE. Neural tube closure in Xenopus laevis involves medial migration, directed protrusive activity, cell intercalation and convergent extension. Development. 1999;126(20):4547–56. - PubMed
    1. Morriss-Kay G, Wood H, Chen WH. Normal neurulation in mammals. Ciba Found Symp. 1994;181:51–63. - PubMed
    1. Lowery LA, Sive H. Strategies of vertebrate neurulation and a re-evaluation of teleost neural tube formation. Mech Dev. 2004;121(10):1189–97. doi: 10.1016/j.mod.2004.04.022. - DOI - PubMed
    1. Smith JL, Schoenwolf GC. Further evidence of extrinsic forces in bending of the neural plate. J Comp Neurol. 1991;307(2):225–36. doi: 10.1002/cne.903070206. - DOI - PubMed
    1. Colas JF, Schoenwolf GC. Towards a cellular and molecular understanding of neurulation. Dev Dyn. 2001;221(2):117–45. doi: 10.1002/dvdy.1144. - DOI - PubMed

Publication types

MeSH terms

LinkOut - more resources