. 2016 Jan 19:6:19375.
doi: 10.1038/srep19375.

Machine learning bandgaps of double perovskites

Affiliations

Machine learning bandgaps of double perovskites

G Pilania et al. Sci Rep. .

Abstract

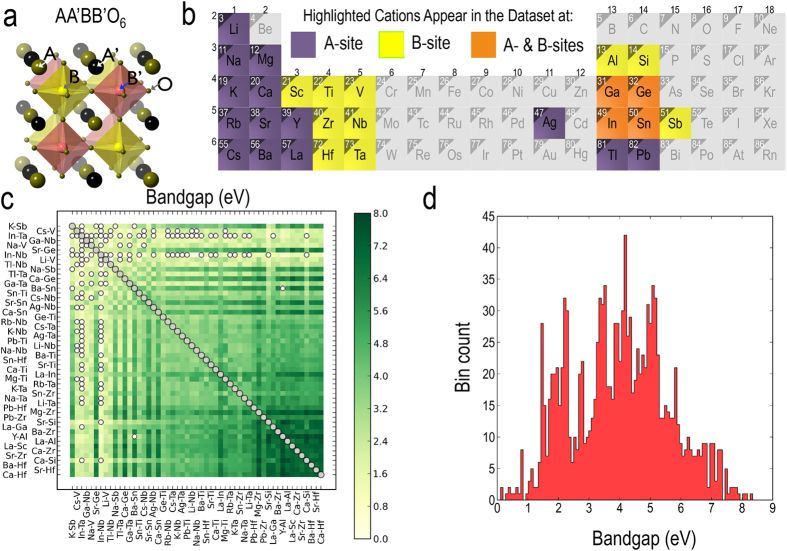
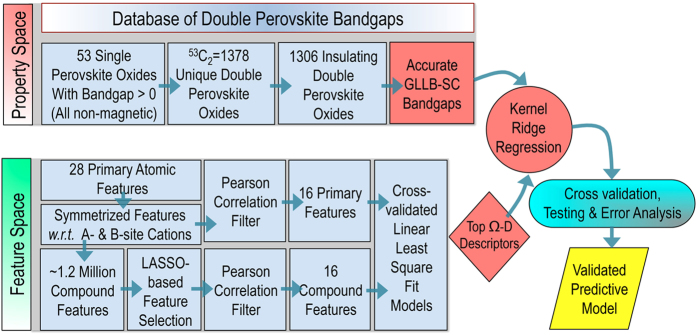
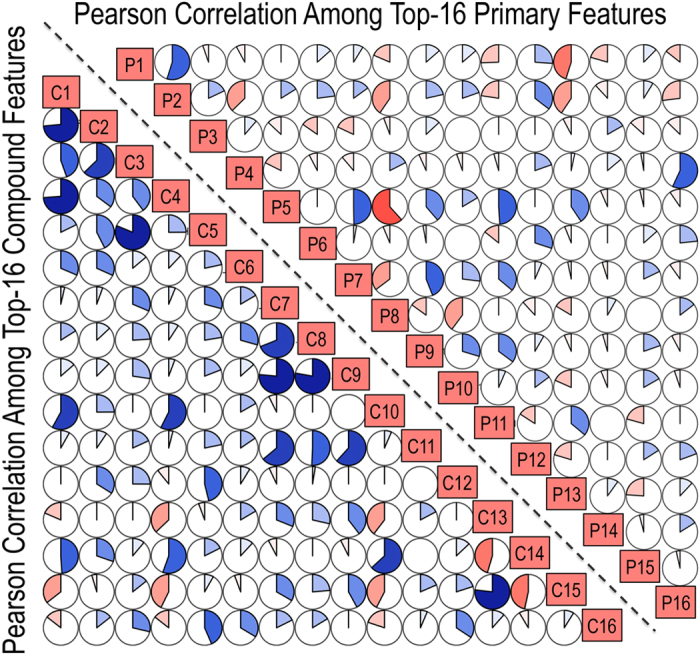
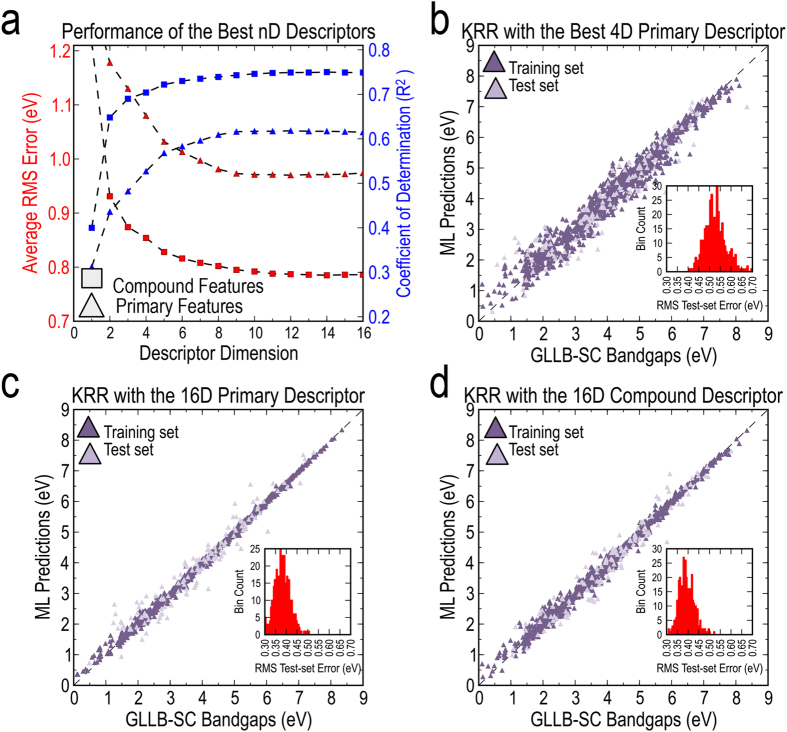
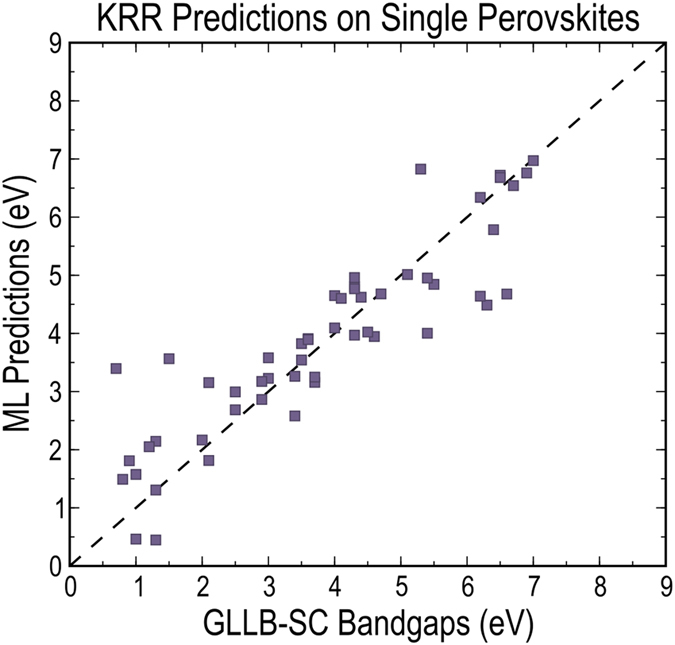
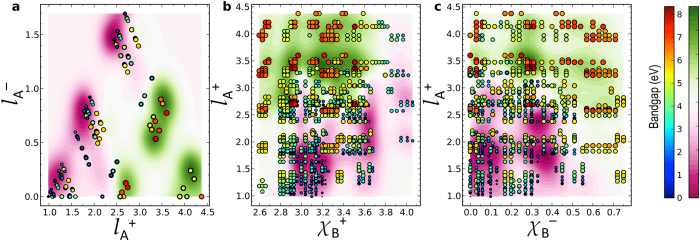
The ability to make rapid and accurate predictions on bandgaps of double perovskites is of much practical interest for a range of applications. While quantum mechanical computations for high-fidelity bandgaps are enormously computation-time intensive and thus impractical in high throughput studies, informatics-based statistical learning approaches can be a promising alternative. Here we demonstrate a systematic feature-engineering approach and a robust learning framework for efficient and accurate predictions of electronic bandgaps of double perovskites. After evaluating a set of more than 1.2 million features, we identify lowest occupied Kohn-Sham levels and elemental electronegativities of the constituent atomic species as the most crucial and relevant predictors. The developed models are validated and tested using the best practices of data science and further analyzed to rationalize their prediction performance.


Figures

Figure 1
Figure 1
(a) Double perovskite crystal structure with rocksalt ordering of both A- and B-site cations. Oxygen octahedral coordination around the B-site cations is explicitly shown. (b) Chemical space of the double perovskite oxides explored in the present study. Cations appearing at the A-site and/or the B-site are highlighted. (c) Matrix plot of the double perovskites bandgaps in the database used in the present study. The abscissa and ordinate represent the A–B cation pairs of the constituent single perovskites. The matrix diagonal, shown with gray circles, represents the 53 single perovskites which were not included in the database. White circles represent the 72 compositions with either zero or negligible bandgaps, which were also not included in the database. (d) Histogram of GLLB-SC bandgaps of 1306 double perovskites used in the development of the ML model presented here.
Figure 2
Figure 2. Overall workflow for the statistical learning model.
Schematic presents the details of the CMR double perovskite bandgap database and outlines the workflow adopted for the primary and compound feature selection, leading to a cross-validated and tested nonlinear regression model for bandgap predictions.
Figure 3
Figure 3. Pearson correlation map for features.
A graphical representation of the Pearson correlation matrix for the downselected primary (labelled as Pi with i ∈  in the upper-right part) and compound (labelled as Ci with i ∈  in the lower-left part) features is presented. Blue and red colors indicate positive and negative correlations, respectively; the lighter the tone used, the less significant the corresponding correlation. The filled fraction of the circle in each of the pie charts corresponds to the absolute value of the associated Pearson correlation coeficient.
Figure 4
Figure 4. Prediction performance of the developed linear and non-linear learning models.
(a) Computed test set rms errors and coefficient of determinations (R2) for the best Ω − D models, with Ω ranging from 1 through 16, in linear least square fit (LLSF) models which are built on either primary or compound features. The prediction performance reported here is computed as an average over 100 different runs, each with randomly selected 90% training and 10% test sets. Representative parity plots comparing the DFT-computed bandgaps against the KRR predicted bandgaps, for (b) the 4-D primary descriptor, (c) the 16-D primary descriptor and (d) the 16-D compound descriptor. Histograms of the test set average rms error, computed over 400 different runs, are also presented as insets in the last three panels.
Figure 5
Figure 5. Predictions on single perovskites.
Prediction performance of the KRR model in predicting the bandgaps of the parent 53 single perovskites, which form all the double perovskites in the database. The model was trained on a randomly selected 90% training set from the double perovskite bandgap database using the 4-D primary descriptor.
Figure 6
Figure 6. Feature-property maps.
(ac) Two dimensional contour maps showing regions of relatively larger and smaller bandgaps in the feature space. In each of the panels, only two of the four features are explicitly presented, while the dependency of the other two features has been integrated out (see text for details). The data-points in the double perovskites dataset are also plotted on top of the contour plots. The marker size and color of the scattered points represent their bandgaps.

References

    1. Curtarolo S. et al. The high-throughput highway to computational materials design. Nat. Mater. 12, 191–201 (2013). - PubMed
    1. Pilania G., Wang C., Jiang X., Rajasekaran S. & Ramprasad R. Accelerating materials property predictions using machine learning. Sci. rep. 3, 2810 (2013). - PMC - PubMed
    1. Sharma V. et al. Rational design of all organic polymer dielectrics. Nat. comm. 5, 4845 (2014). - PubMed
    1. Ceder G., Hauthier G., Jain A. & Ong S. P. Recharging lithium battery research with first-principles methods. Mater. Res. Soc. Bull. 36, 185–191 (2011).
    1. Curtarolo S. et al. AFLOWLIB.ORG: AFLOWLIB. ORG: A distributed materials properties repository from high-throughput ab initio calculations. Comput. Mater. Sci. 58, 227 (2012).

Publication types

LinkOut - more resources