. 2016 Jan 18;212(2):199-217.
doi: 10.1083/jcb.201505105.

P-cadherin promotes collective cell migration via a Cdc42-mediated increase in mechanical forces

Affiliations

P-cadherin promotes collective cell migration via a Cdc42-mediated increase in mechanical forces

Cédric Plutoni et al. J Cell Biol. .

Abstract

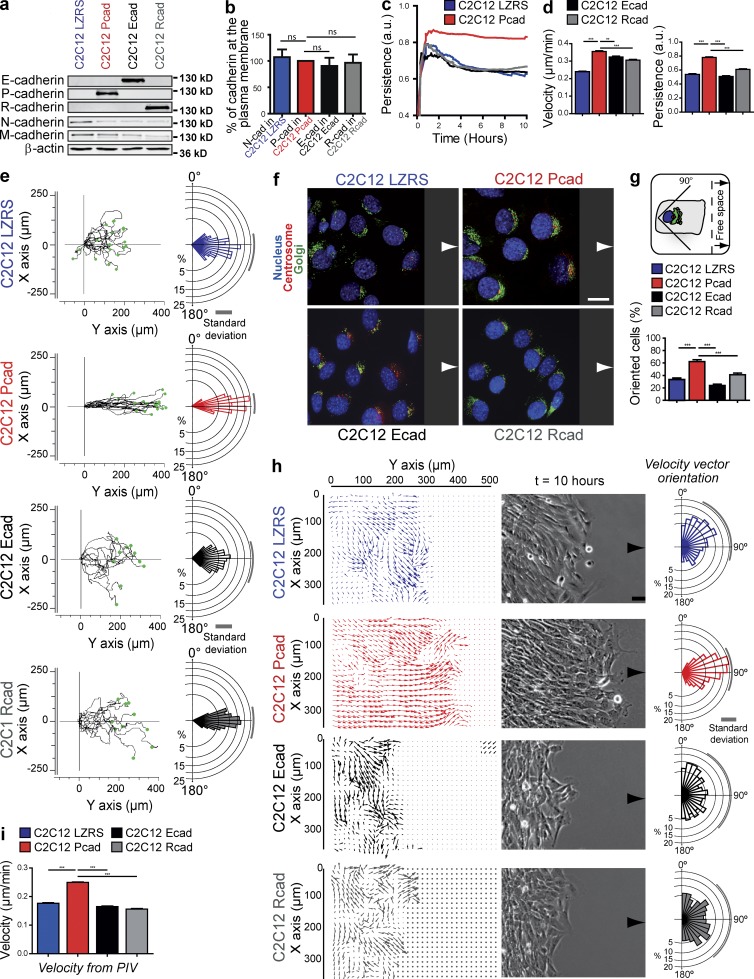
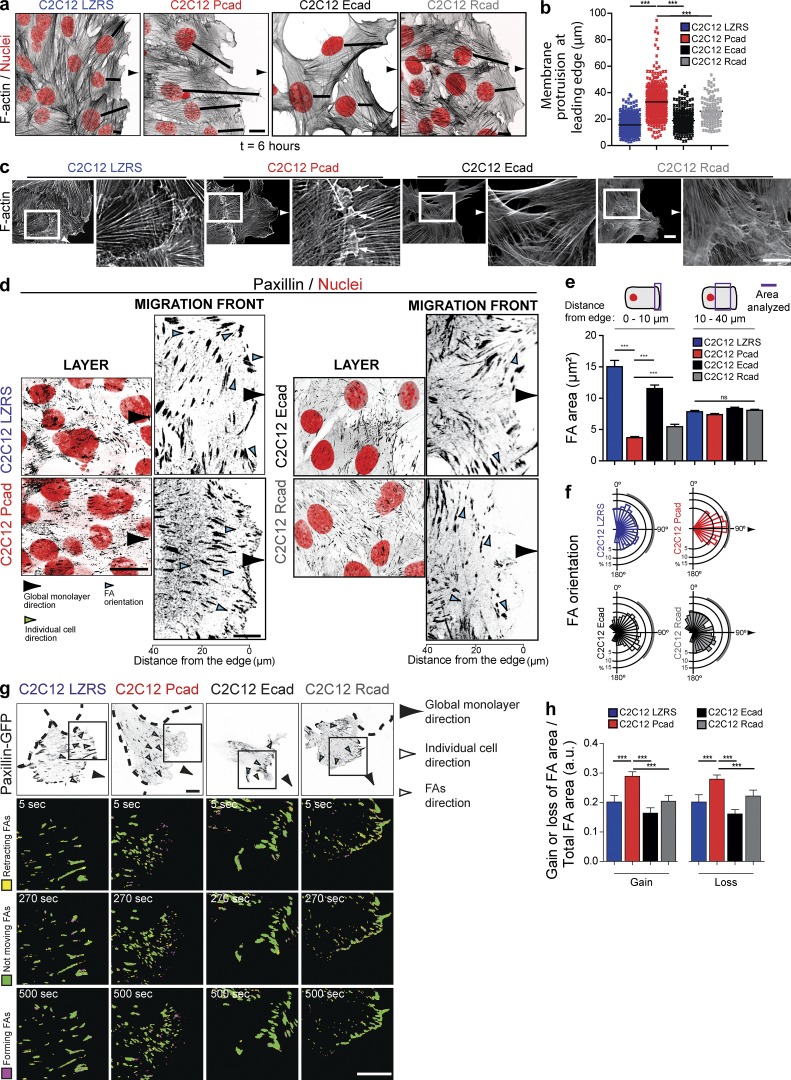
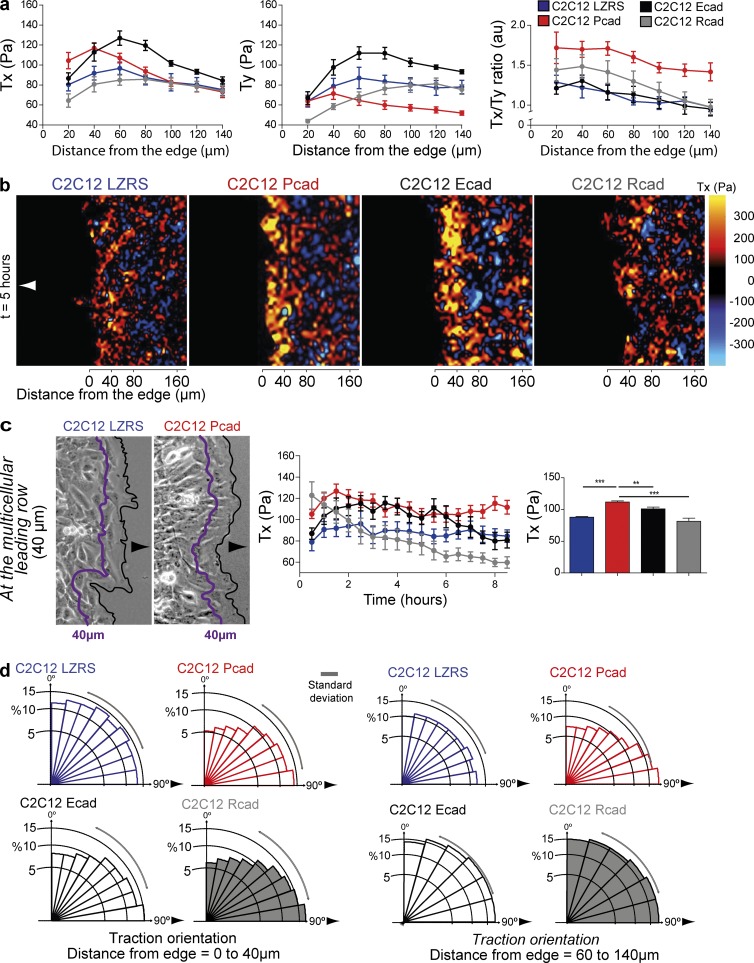
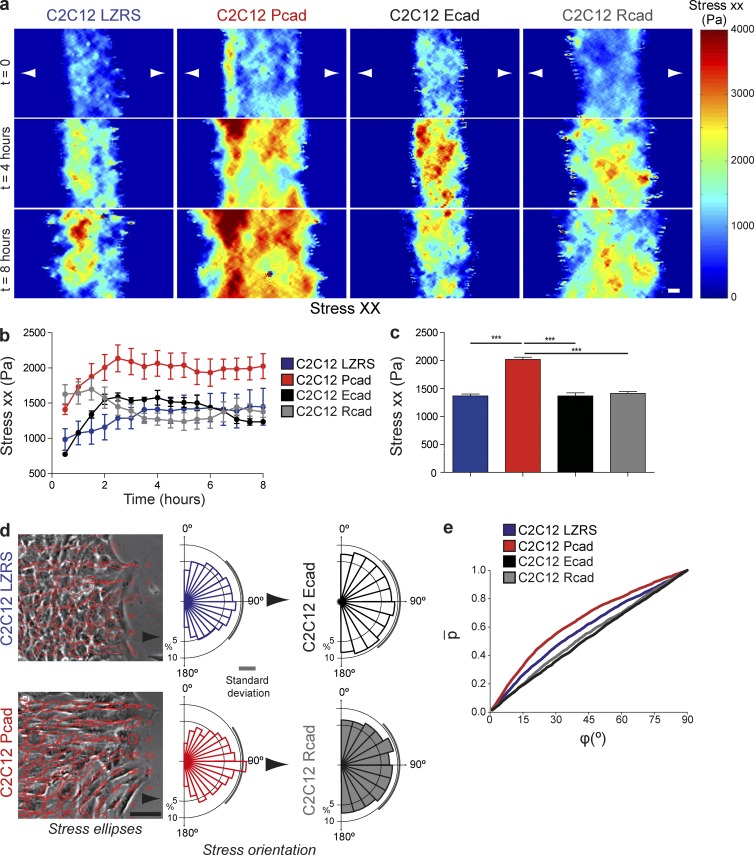
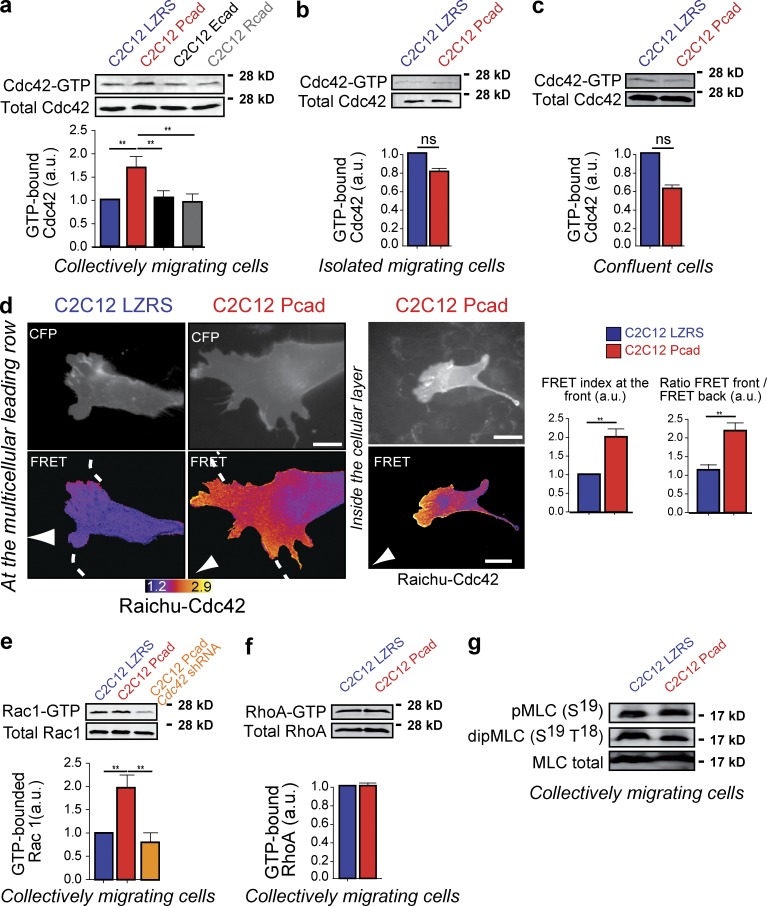
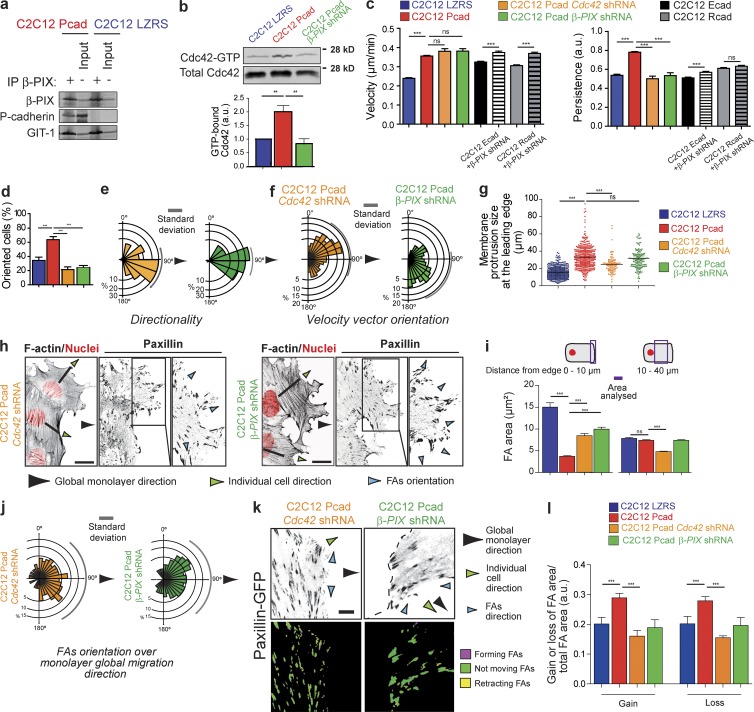
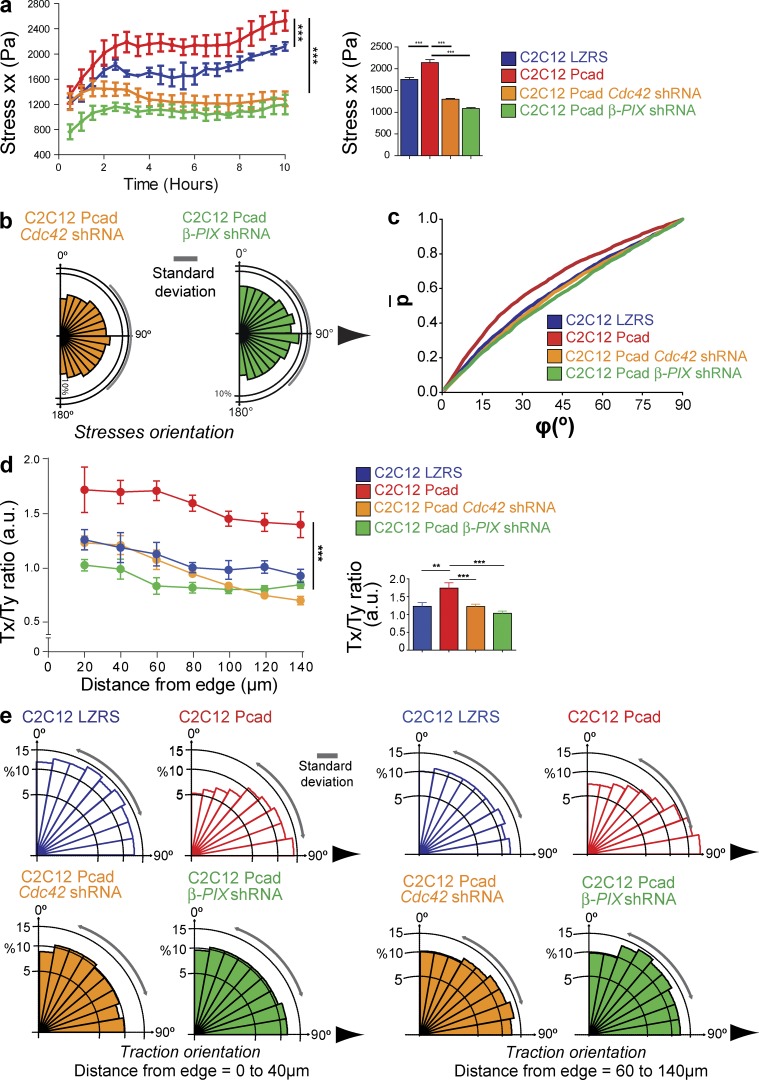
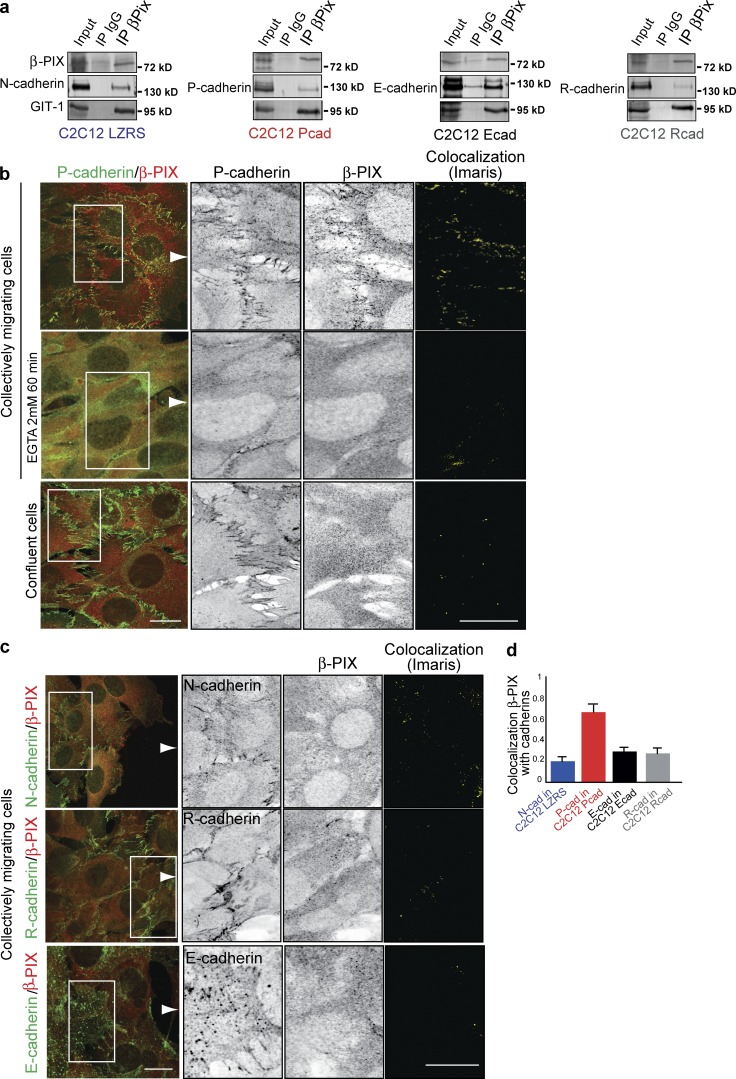
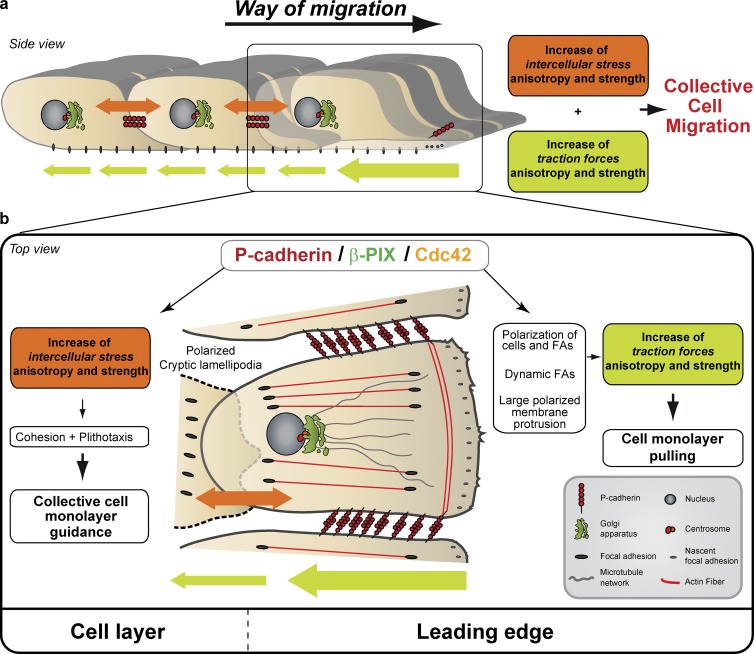
Collective cell migration (CCM) is essential for organism development, wound healing, and metastatic transition, the primary cause of cancer-related death, and it involves cell-cell adhesion molecules of the cadherin family. Increased P-cadherin expression levels are correlated with tumor aggressiveness in carcinoma and aggressive sarcoma; however, how P-cadherin promotes tumor malignancy remains unknown. Here, using integrated cell biology and biophysical approaches, we determined that P-cadherin specifically induces polarization and CCM through an increase in the strength and anisotropy of mechanical forces. We show that this mechanical regulation is mediated by the P-cadherin/β-PIX/Cdc42 axis; P-cadherin specifically activates Cdc42 through β-PIX, which is specifically recruited at cell-cell contacts upon CCM. This mechanism of cell polarization and migration is absent in cells expressing E- or R-cadherin. Thus, we identify a specific role of P-cadherin through β-PIX-mediated Cdc42 activation in the regulation of cell polarity and force anisotropy that drives CCM.


Figures

Figure 1.
Figure 1.
P-cadherin expression induces CCM. (a) Protein extracts (20 µg/well) from the indicated cells were immunoblotted to detect E-, P-, R-, N-, and M-cadherin and β-actin. (b) Quantification of the indicated cadherins at the plasma membrane, normalized to the total amount of the corresponding cadherin, calculated from three independent experiments. (c and d) Persistence over 10 h after removal of the insert (c) and mean velocity and persistence measured between 4 and 15 h after removal of the insert (d). n = 242 C2C12 LZRS and 249 C2C12 Pcad cells from 15 independent experiments and 230 C2C12 Ecad and 171 C2C12 Rcad cells from 4 independent experiments. a.u., arbitrary units. (e) Trajectories over 15 h of 17 representative cells. Rose plots of angle trajectories (i.e., directionality). The magnitude of each bar shows the fraction of cells with the indicated angle trajectory. n = 193. (f) Migrating cells (8 h after insert removal) stained for nucleus, centrosome, and Golgi distribution. Arrows indicate the migration direction. (g) Histogram representing the percentage of migrating cells in which the centrosome and Golgi are located in the quadrant facing the free space in front of the nucleus (see cartoon) as an indication of cell polarization. n = 80 cells from five independent experiments. (h) Velocity fields and corresponding phase-contrast images and velocity vector orientation measured using MatPIV in the entire cell layer 10 h after insert removal. n = 983 C2C12 LZRS, 1006 C2C12 Pcad, 677 C2C12 Ecad, and 633 C2C12 Rcad. (i) Mean velocity measured in the entire cell layer from 4 to 15 h. All panels: means ± SEM. *, P < 0.05; **, P < 0.005; ***, P < 0.0005. Bars: (f) 15 µm; (h) 100 µm.
Figure 2.
Figure 2.
Specific cellular and FA organization after P-cadherin expression. (a and b) F-actin (black, inverted contrast image) and nuclei (red) visualization indicating the formation of a large protrusion in P-cadherin–expressing cells as illustrated in the box plots. 384 (C2C12 LZRS), 373 (C2C12 Pcad), 115 (C2C12 Ecad), and 263 (C2C12Rcad) cells from four independent experiments were analyzed. Bar, 10 µm. ***, P < 0.0005. (c) F-actin staining of the four cell lines revealed cryptic lamellipodia in C2C12 Pcad cells (arrows). The right panels show higher-magnification images of the outlined region (white rectangle). Bars, 10 µm. (d) Confocal images of migrating cells stained for paxillin (inverted contrast images) and nuclei (red) are shown. Left panels, inside the layer; right panels, at the migration front. Bar, 10 µm. (e) Quantification of the FA area measured 0–10 µm or 10–40 µm from the leading edge. The presented value is the ratio of the area to the total surface. Data represent the means ± SEM of five independent experiments. More than 400 FAs were analyzed from 30 cells. ***, P < 0.0005. (f) Rose plot showing the distribution of the orientation angles of the FAs calculated using the monolayer migration direction as the reference axis (90°). The area of each bin represents the number of FAs in that direction. More than 2000 FAs were analyzed from three independent experiments. (g) Paxillin-GFP dynamics in cells at the first multicellular row were monitored at 8 h after removal of the insert at 5-s intervals for 15 min; inverted contrast images are shown. Dashed lines indicate the nontransfected surrounding cells. The insets indicate a cell area shown at three time points. Inverted contrast images of paxillin-GFP are in gray. Ratio images were generated to illustrate FA dynamics. Bars, 15 µm. (h) FA area was quantified over a period of 15 min, and mean values normalized to the area of the FA as well as the change in mean intensity are given. The means ± SEM of five independent cells are shown. a.u., arbitrary units.
Figure 3.
Figure 3.
P-cadherin expression reorganizes and increases traction forces. (a) Traction forces in the x direction (Tx), i.e., parallel to the axis of migration, or in the y direction (Ty), i.e., perpendicular to the axis of migration, measured every 20 µm from the multicellular leading row toward the center of the layer 4–10 h after removal of the PDMS membrane. The Tx/Ty ratio is calculated in the same conditions. Histograms represent the mean ± SEM calculated from n = 6 for each cell line from three independent experiments. au, arbitrary units. (b) Representative image of the traction (Tx) force maps at 6 h after removal of the PDMS membrane. Color bar indicates relative values. Arrowheads indicate the direction of migration. (c) Tx measured from 0 to 40 µm (as indicated in the phase-contrast images; arrowheads indicate the direction of migration) at 0–8 h. Histogram representing the mean ± SEM of Tx over 8 h. n = 6. (d) Overall orientation of traction forces. n = 6 from three independent experiments. All panels: values are means ± SEM. **, P < 0.005; ***, P < 0.0005; ns, nonsignificant.
Figure 4.
Figure 4.
P-cadherin expression increases intercellular stress. (a) Intercellular stress maps parallel to the migration direction (stress xx) measured at the indicated time after removal of the PDMS membrane. n = 6 areas analyzed for each cell line from three independent experiments. (b) Stress xx over 8 h after removal of the insert. (c) Histograms of the maximum principal stress measured over 8 h. n = 6. (d) Principal stress ellipses at 8 h after removal of the PDMS membrane and rose plots of the angle between the principal stress direction and velocity. Arrows indicate the direction of migration. n = 6. (e) Cumulative probability distribution of the angle between cellular velocity and the maximum principal stress for the highest quintile of stress anisotropy (measured using the maximum shear stress). All panels: values are the means ± SEM. ***, P < 0.0005. Bars: (a) 40 µm; (d) 100 µm.
Figure 5.
Figure 5.
P-cadherin–dependent Cdc42 activation during CCM. (a–c) The level of GTP-bound Cdc42 was measured using GST fused to the CRIB domain of PAK (GST-CRIB) in lysates obtained from cells 5–6 h after wounding (a), in migrating isolated cells (b), and in confluent (c) C2C12 LZRS and C2C12 Pcad cells. Cdc42 was detected by immunoblotting. Histograms represent the GTP-bound Cdc42 normalized to the amount of total protein. The mean ± SEM of five independent experiments is shown. (d) Cdc42 activity was mapped using the FRET reporter Raichu-Cdc42. Examples of increased Cdc42 activity after P-cadherin expression at the leading edge of the migrating cells and at cell–cell contacts inside the cellular layer are shown. Histograms represent the quantification of the FRET index at the front of C2C12 LZRS and C2C12 Pcad migrating cells (top) and the ratio of the FRET index between the front and back in these cells (bottom). n = 42 for C2C12 LZRS and 56 for C2C12 Pcad cells. The mean ± SEM of four independent experiments is shown. (e and f) Levels of GTP-bound Rac1 (e) or RhoA (f) were measured using GST fused to the CRIB domain of PAK (GST-CRIB) or to the RhoA binding domain of Rhotekin, respectively, in lysates obtained from cells 5–6 h after wounding. GTPase was detected by immunoblotting, and histograms represent the GTP-bound GTPase normalized to the amount of total protein. The mean ± SEM of five independent experiments is shown. (g) The level of MLC phosphorylation was analyzed using antibodies that recognize mono- and di-phospho-MLC in cell lysates of C2C12 LZRS and C2C12 Pcad cells 6 h after wounding. Shown are representative Western blot images from three independent experiments. a.u., arbitrary units. **, P < 0.005.
Figure 6.
Figure 6.
Cdc42 and β-PIX are required for P-cadherin–induced CCM. (a) Lysates of C2C12 LZRS or C2C12 Pcad cells were immunoprecipitated using an anti–β-PIX antibody and immunoblotted for β-PIX, P-cadherin, and GIT-1, a known β-PIX partner. (b) The level of GTP-bound Cdc42 was measured using GST fused to the CRIB domain of PAK (GST-CRIB) in lysates obtained from cells 5–6 h after wounding in C2C12 LZRS, C2C12 Pcad, and C2C12 Pcad cells in which β-PIX was knocked down. Cdc42 was detected by immunoblotting. Histograms represent the GTP-bound Cdc42 normalized to the amount of total protein. The mean ± SEM of five independent experiments is shown. (c) Velocity and persistence of migration measured 4–15 h after removal of the insert in the indicated cells. n = 45 C2C12 Pcad Cdc42 shRNA cells, 50 C2C12 Pcad β-PIX shRNA cells, 230 C2C12 Ecad, 171 C2C12 Rcad, 97 C2C12 Ecad β-PIX shRNA, and 70 C2C12 Rcad β-PIX shRNA cells. The mean ± SEM of five independent experiments is shown. (d) Histogram quantifying cell polarity shown in Fig. S5 h. n = 120 C2C12 Pcad Cdc42 shRNA cells, 90 C2C12 Pcad β-PIX shRNA cells. (e) Rose plots of angle trajectories (i.e., directionality) shown in Fig. S5 i. (f) Orientation of the velocity vector (in Fig. S5 j) measured using MatPIV software in the entire cell layer at 10 h after insert removal. n = 1006 C2C12 Pcad Cdc42 shRNA; 998 C2C12 Pcad β-PIX shRNA cells. Arrowheads indicate the monolayer global migration direction. Compare with Fig. 1 h. (g) Box plots showing the size of membrane protrusions in the indicated cells. Shown is the mean ± SEM: ***, P < 0.0005; ns: nonsignificant. (h) C2C12 Pcad Cdc42 shRNA or β-PIX shRNA cells 8 h after removal of the insert were stained for nuclei (red), F-actin, and paxillin (inverted contrast images). Bar, 15 µm. (i) Quantification of the FA area measured 0–10 µm or 10–40 µm from the leading edge. More than 700 FAs were analyzed from 50 cells. Data represent the mean ± SEM of five independent experiments. (j) Rose plot showing the distribution of angles of FA orientation calculated using the monolayer migration direction as the reference axis; 90° corresponds to the reference axis. More than 700 FAs were analyzed from 50 cells. Data represent the mean ± SEM of five independent experiments. (k) Cells were transfected with paxillin-GFP, and FA dynamics were analyzed as described in Fig. 2 g. An inverted contrast image of paxillin-GFP is in gray. Ratio images (lower panels) were generated to illustrate FA dynamics, with magenta showing the extension and yellow the FA loss. Green represents the FA area maintained during the analyzed period. Bar, 10 µm. (l) FA area gains and losses were quantified over 15 min. The mean values normalized to the area of the FA as well as the change in mean intensity is given. For all panels, the mean ± SEM is shown: ***, P < 0.0005. a.u., arbitrary units.
Figure 7.
Figure 7.
P-cadherin–induced mechanical force generation requires β-PIX and Cdc42. (a) Intercellular stress maps parallel to the migration direction (stress xx) measured at the indicated migration time and corresponding histograms of the maximum principal stress measured over 10 h. n = 6 for C2C12 Pcad Cdc42 shRNA cells and for C2C12 Pcad β-PIX shRNA cells from three independent experiments. (b) Rose plots of the angle between the principal stress direction and velocity at 8 h after removal of the PDMS membrane. Arrows indicate the migration direction. n = 6. (c) Cumulative probability distribution of the angle between cellular velocity and the maximum principal stress for the highest quintile of stress anisotropy (measured using the maximum shear stress). (d) The Tx/Ty ratio measured every 20 µm from the multicellular leading row toward the center of the layer 4–10 h after removal of the PDMS membrane. Error bars show 95% confidence interval of the mean (95% SEM); all nonoverlapping error bars are statistically significant with P < 0.05. (e) Overall orientation of traction forces 0–40 or 60–140 µm from the multicellular leading row. n = 6 from three independent experiments. For all panels, data are the mean ± SEM: **, P < 0.005; ***, P < 0.0005.
Figure 8.
Figure 8.
β-PIX is specifically recruited at CCJ by P-cadherin. (a) C2C12 LZRS or C2C12 Pcad, Ecad, or Rcad cell lysates were immunoprecipitated using an anti–β-PIX antibody and immunoblotted to assess the expression of β-PIX, GIT-1, and the indicated cadherins. (b and c) Inverted contrast and merge images of the expression of β-PIX and P-cadherin in C2C12 Pcad cells (b) incubated or not with EGTA at 8 h after removal of the insert or in confluent C2C12 Pcad cells, N-cadherin in C2C12 Pcad cells (c), E-cadherin in C2C12 Ecad cells, and R-cadherin in C2C12 Rcad cells. Colocalization images were generated using the colocalization module of Imaris. Bar, 10 µm. (d) Colocalization of β-PIX and cadherins at the CCJ as Pearson’s correlation coefficient; n = 15 images for each condition.
Figure 9.
Figure 9.
Model for the role of P-cadherin in CCM. (a) P-cadherin expression promotes CCM through an increase in the strength and anisotropy of physical forces; it is associated with an increase in intercellular stresses anisotropy and strength that promotes collective cell guidance called plithotaxis. P-cadherin expression also increases traction-force anisotropy (through increasing the Tx/Ty ratio) and strength that pull the cell layer. (b) P-cadherin expression induces polarization because it activates Cdc42 through the GEF β-PIX; this generates biological cues, such as polarization of the cell layer, of cryptic lamellipodia and FAs in the migration direction, polarized membrane protrusion generation and FA dynamics, thereby controlling mechanical force anisotropy and strength.

References

    1. Alexander S., Weigelin B., Winkler F., and Friedl P.. 2013. Preclinical intravital microscopy of the tumour-stroma interface: Invasion, metastasis, and therapy response. Curr. Opin. Cell Biol. 25:659–671. 10.1016/j.ceb.2013.07.001 - DOI - PubMed
    1. Arboleda-Estudillo Y., Krieg M., Stühmer J., Licata N.A., Muller D.J., and Heisenberg C.P.. 2010. Movement directionality in collective migration of germ layer progenitors. Curr. Biol. 20:161–169. 10.1016/j.cub.2009.11.036 - DOI - PubMed
    1. Bazellières E., Conte V., Elosegui-Artola A., Serra-Picamal X., Bintanel-Morcillo M., Roca-Cusachs P., Muñoz J.J., Sales-Pardo M., Guimerà R., and Trepat X.. 2015. Control of cell-cell forces and collective cell dynamics by the intercellular adhesome. Nat. Cell Biol. 17:409–420. 10.1038/ncb3135 - DOI - PMC - PubMed
    1. Beningo K.A., Dembo M., Kaverina I., Small J.V., and Wang Y.L.. 2001. Nascent focal adhesions are responsible for the generation of strong propulsive forces in migrating fibroblasts. J. Cell Biol. 153:881–888. 10.1083/jcb.153.4.881 - DOI - PMC - PubMed
    1. Buckley C.D., Tan J., Anderson K.L., Hanein D., Volkmann N., Weis W.I., Nelson W.J., and Dunn A.R.. 2014. Cell adhesion. The minimal cadherin-catenin complex binds to actin filaments under force. Science. 346:1254211 10.1126/science.1254211 - DOI - PMC - PubMed

Publication types

Associated data