

Bax assembly into rings and arcs in apoptotic mitochondria is linked to membrane pores
- PMID: 26783362
- PMCID: PMC4755116
- DOI: 10.15252/embj.201593384
Bax assembly into rings and arcs in apoptotic mitochondria is linked to membrane pores
Abstract
Bax is a key regulator of apoptosis that, under cell stress, accumulates at mitochondria, where it oligomerizes to mediate the permeabilization of the mitochondrial outer membrane leading to cytochrome c release and cell death. However, the underlying mechanism behind Bax function remains poorly understood. Here, we studied the spatial organization of Bax in apoptotic cells using dual-color single-molecule localization-based super-resolution microscopy. We show that active Bax clustered into a broad distribution of distinct architectures, including full rings, as well as linear and arc-shaped oligomeric assemblies that localized in discrete foci along mitochondria. Remarkably, both rings and arcs assemblies of Bax perforated the membrane, as revealed by atomic force microscopy in lipid bilayers. Our data identify the supramolecular organization of Bax during apoptosis and support a molecular mechanism in which Bax fully or partially delineates pores of different sizes to permeabilize the mitochondrial outer membrane.
Keywords: AFM; Bcl‐2; apoptosis; pore‐forming protein; super‐resolution microscopy.
© 2016 The Authors.
Figures
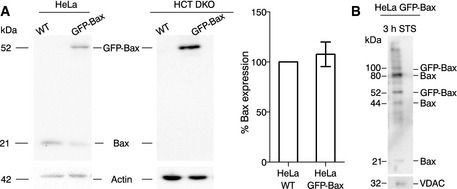
Analysis of Bax protein levels in HeLa and HCT116 Bax/Bak−/− cells (wild‐type and overexpressing GFP‐Bax) by Western blot. The bar graph corresponds to the quantification of Bax expression in HeLa WT and HeLa GFP‐Bax cells. Protein expression was first corrected with respect to the loading control (actin). Then, the expression of endogenous Bax from WT cells was normalized to 100% and compared with the total amount Bax (arising from endogenous protein and GFP‐Bax) in transfected cells. Mean ± SEM of three independent experiments.
Analysis of Bax translocation and oligomerization in mitochondria by Western blot. VDAC, loading control.
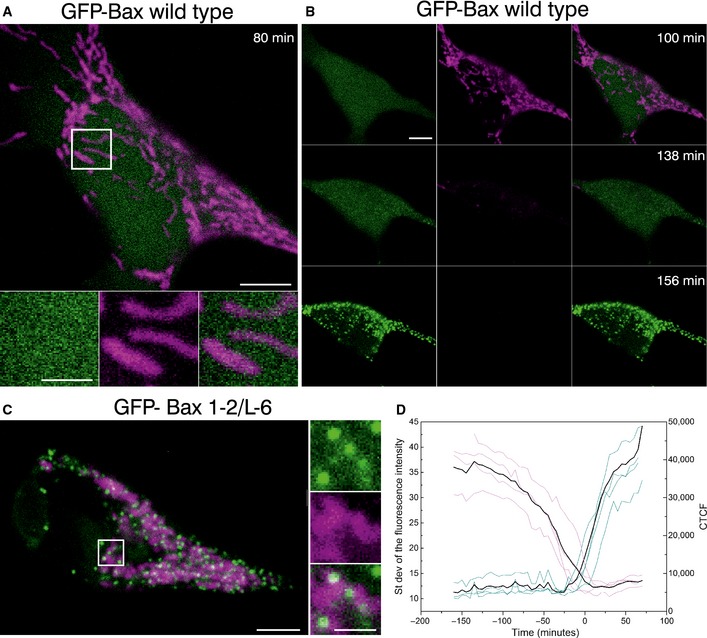
Confocal live cell imaging of HeLa cells overexpressing GFP‐Bax (green) and mitochondria marked with TMRE 100 nM (magenta) show cytosolic GFP‐Bax distribution and healthy mitochondria. Lower panels are zoomed images corresponding to the white rectangle in the upper panel and represent the individual and merged channels. Time shows the minutes after apoptosis induction with staurosporine (STS) 1 μM. Scale bars, 5 μm (overview) and 2 μm (zooms)
HeLa cells shown in (A) at longer times after STS treatment. Images show sequential GFP‐Bax translocation (green), which correlates with mitochondria depolarization (TMRE, magenta). Scale bars, 5 μm.
HeLa cells overexpressing GFP‐Bax mutant (1‐2/L‐6) (green) and mitochondria marked with TMRE 100 nM (magenta). Images show constitutive GFP‐Bax localization to healthy mitochondria without apoptosis induction. Right panels are zoomed images corresponding to the white rectangle in the left panel and represent the individual and overlaid channels. Scale bars, 5 μm (overview) and 2 μm (zooms).
Standard deviation of the fluorescence intensity of GFP‐Bax (blue) versus the corrected total cell fluorescence (CTCF) of TMRE (purple) in individual cells (N = 4). CTCF = Integrated Density – (Area of selected cell × Mean fluorescence of 3 background readings). Time 0 corresponds to the normalized time when both events cross in each cell. Black line represents the average of the individual cells.
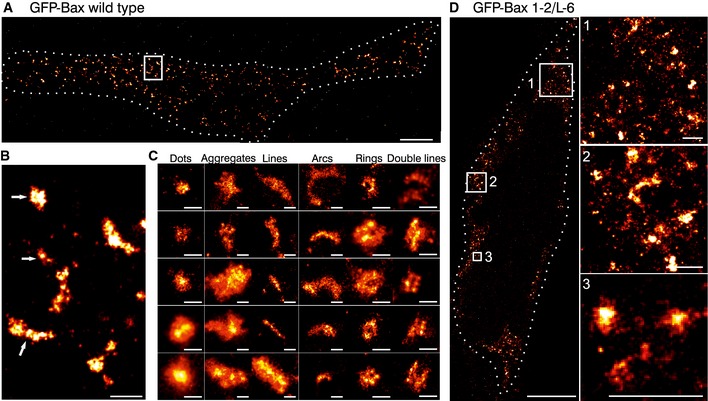
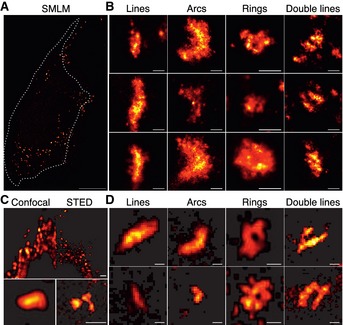
Overview of a reconstructed super‐resolution image of GFP‐Bax‐overexpressing HeLa cells stained with AF647‐anti‐GFP nanobodies. Image was acquired on fixed cells 3 h after apoptosis induction with STS. Dotted line shows the cell shape (see Fig EV2). Scale bar, 5 μm.
Magnified reconstructed super‐resolution image corresponding to the white rectangle in (A) showing the shapes of GFP‐Bax WT structures (white arrows). Scale bar, 500 nm.
Gallery of typical GFP‐Bax WT structures during apoptosis found in all the analyzed cells. Scale bars, 100 nm.
Overview (left) and 3 enlarged insets (right) of HeLa cells overexpressing GFP‐Bax 1‐2/L‐6 stained with AF647‐anti‐GFP nanobodies. Figure shows reconstructed super‐resolution images acquired without apoptosis induction. Scale bars, 5 μm (overview) and 500 nm (insets).
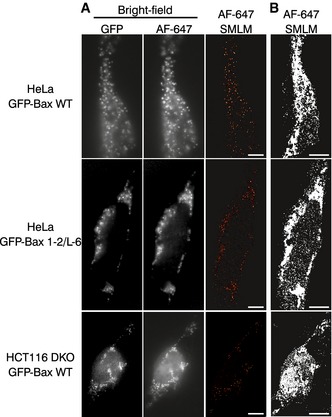
Bright field images and SMLM overviews of HeLa and HCT116 DKO cells overexpressing GFP‐Bax or GFP‐Bax 1‐2/L‐6, respectively. Bright field images were taken in the GFP and AF647 channels before acquisition with single‐molecule localization. Scale bars, 500 nm.
SMLM images shown in (A) reconstructed with all the localizations and no cutoff applied. Pictures were converted to binary images and a black‐white mask was applied to define the cell shape. Scale bars, 500 nm.
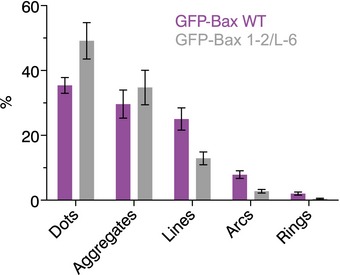
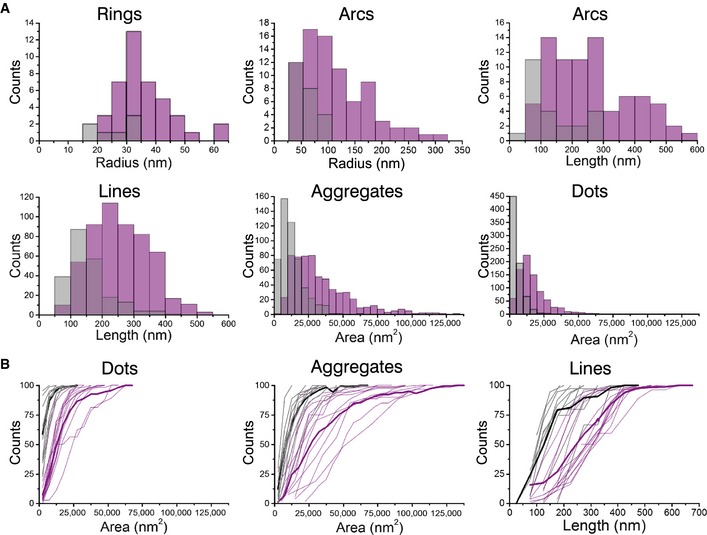
Quantification of the structures found on Bax wild‐type (purple) and on Bax 1‐2/L‐6 (gray) overexpressing cells. Data show the total number of structures in all the measurements. n (Bax wild‐type) = 13, n (Bax 1‐2/L‐6) = 11.
Cumulative distribution plots of GFP‐Bax wild‐type (purple) and GFP‐Bax 1‐2/L‐6 (gray) showing differences in amplitude and frequency. Each plot represents a single cell. Thick lines represent average cumulative distributions for all the single cells transfected with GFP‐Bax WT or mutant GFP‐Bax 1‐2/L‐6.
Overview of a reconstructed super‐resolution image of GFP‐Bax‐overexpressing HCT116 Bax/Bak−/− cells stained with AF647‐anti‐GFP nanobodies. Image was acquired on fixed cells 7 h after apoptosis induction with STS. Dotted line shows the cell shape (see Fig EV2). Scale bar, 5 μm.
Gallery of typical GFP‐Bax WT non‐random structures during apoptosis on HCT116 Bax/Bak−/− cells. Scale bars, 100 nm.
Comparison of confocal (left) and STED (right) images of GFP‐Bax‐overexpressing HeLa cells 2 h after STS treatment. STED reveals a notable increase in resolution. Scale bars, 500 nm.
Representative GFP‐Bax non‐random structures found with STED (lines, arcs, rings, double lines). Scale bars, 100 nm.
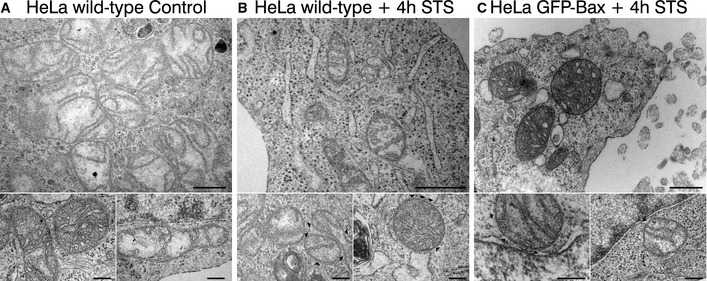
Representative TEM pictures of HeLa wild‐type cells. Bottom panels show healthy mitochondria. Scale bars, 500 nm (overview) and 200 nm (zooms).
Representative TEM pictures of apoptotic HeLa wild‐type cells 4 h after STS treatment (1 μM). Black arrowheads point to defects on the mitochondrial outer membrane. Scale bars, 500 nm (overview) and 200 nm (zooms).
Representative TEM pictures of apoptotic HeLa GFP‐Bax‐transfected cells 4 h after STS treatment (1 μM). Black arrowheads point to defects on the mitochondrial outer membrane. Scale bars, 500 nm (overview) and 200 nm (zooms).
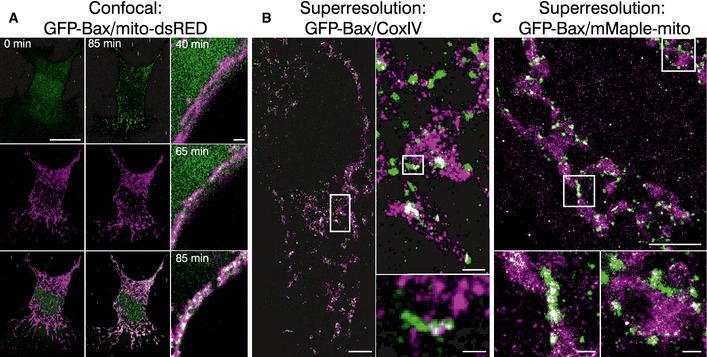
Left panel shows the individual channels and overlaid images of confocal live cell imaging of HeLa cells overexpressing GFP‐Bax (green) and mito‐dsRed (magenta) at 0 and 85 min after apoptosis induction with STS 1 μM. Right panel shows zoomed overlaid images of HeLa cells following GFP‐Bax translocation (green) and mitochondrial fragmentation (magenta) during apoptosis induction with STS 1 μM. Scale bars, 10 μm (left) and 2 μm (right)
Reconstructed dual‐color super‐resolution image of GFP‐Bax‐overexpressing HeLa cells. GFP‐Bax was imaged by immunostaining with AF647‐anti‐GFP nanobodies and mitochondria were immunostained with CoxIV (primary) and cf680 (secondary) antibodies. Image was acquired 3 h after STS treatment. Left panel shows the cell overview (scale bar, 5 μm), right panel up shows the overview inset (scale bar, 500 nm), and right panel down shows a non‐random linear GFP‐Bax assembly at mitochondria (scale bar, 100 nm).
Reconstructed dual‐color super‐resolution image of HeLa cells co‐overexpressing mMaple‐mito and GFP‐Bax and stained with AF647‐anti‐GFP nanobodies. Image was acquired 3 h after STS treatment. Lower panel shows enlarged insets corresponding to the white rectangles in the upper panel. Scale bars, 1 μm (overview) and 100 nm (insets)
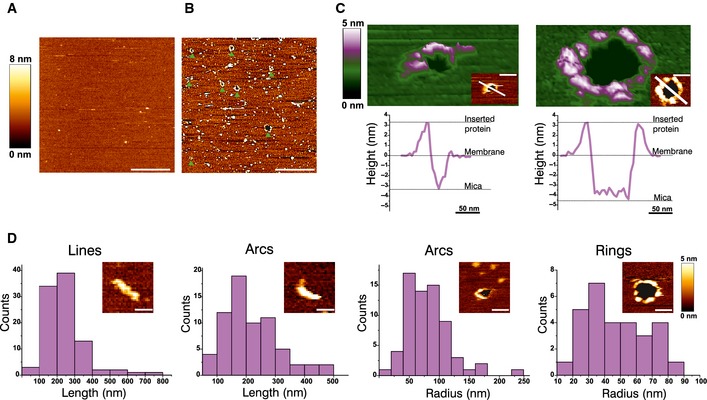
AFM image of a control SLB prepared from LUVs with a mitochondrial‐like lipid composition. The bilayer looks flat, without aggregates or defects. Scale bar, 1 μm.
AFM image of a SLB prepared from LUVs with a mitochondrial‐like lipid composition pre‐incubated with heat‐activated Bax. The green arrowheads indicate the presence of membrane pores, which are heterogeneous in size and shape. The edges of the pores present protrusions corresponding to Bax clusters. Scale bar, 1 μm.
3D AFM topography of a Bax arc (left) and ring (right). Both images reveal a circular dark hole that spans the lipid membrane (green). Bax molecules around the pore rim (magenta and white) protrude 3.97 ± 1.02 nm above the membrane plane, as confirmed by the height profiles shown below each image (corresponding to the white line in the 2D image insets). The topography of the arc structure reveals a pore only partially surrounded by Bax molecules, while lipids alone form the rest of the pore rim. Images are shown in a 42° tilted representation.
Quantitative analysis of the distinct structures found for activated Bax on SLBs. Data show the total number of structures in all the measurements.
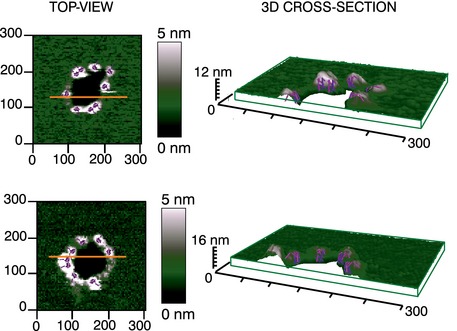
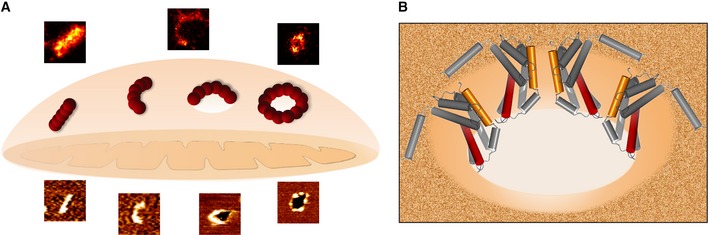
Illustration of the possible roles for the Bax non‐random assemblies revealed by SMLM and AFM during apoptosis. Linear and arc clusters not perforating the membrane could correspond to Bax at initial stages of gathering on healthy mitochondria. They would evolve toward opening of membrane pores, where the protein is covering completely (full rings) or partially (arcs) the pore rim. We cannot exclude that a fraction of the linear and arc‐shaped assemblies correspond to Bax pores observed from different perspectives. The number of red spheres (Bax dimers) is illustrative and does not need to correlate with the actual number present in the structures.
The mechanism by which Bax permeabilizes the membrane is mainly by releasing the curvature stress at the membrane edge. Full as well as partial coverage of the pore rim by Bax molecules could reduce line tension enough to stabilize the open pore state. The illustration shows an incomplete ring assembly of active Bax dimers adopting a clamp‐like structure at the pore interface (Bleicken et al, 2014).
Comment in
-
Doughnuts, daisy chains and crescent moons: the quest for the elusive apoptotic pore.EMBO J. 2016 Feb 15;35(4):371-3. doi: 10.15252/embj.201593723. Epub 2016 Jan 18. EMBO J. 2016. PMID: 26783365 Free PMC article.
References
-
- Antonsson B (2001) Bax and other pro‐apoptotic Bcl‐2 family “killer‐proteins” and their victim the mitochondrion. Cell Tissue Res 306: 347–361 - PubMed
-
- Basanez G, Sharpe JC, Galanis J, Brandt TB, Hardwick JM, Zimmerberg J (2002) Bax‐type apoptotic proteins porate pure lipid bilayers through a mechanism sensitive to intrinsic monolayer curvature. J Biol Chem 277: 49360–49365 - PubMed
Publication types
MeSH terms
Substances
Grants and funding
LinkOut - more resources
Full Text Sources
Other Literature Sources
Research Materials
Miscellaneous
