

Six Year Refractive Change among White Children and Young Adults: Evidence for Significant Increase in Myopia among White UK Children
- PMID: 26783753
- PMCID: PMC4718680
- DOI: 10.1371/journal.pone.0146332
Six Year Refractive Change among White Children and Young Adults: Evidence for Significant Increase in Myopia among White UK Children
Abstract
Objective: To determine six-year spherical refractive error change among white children and young adults in the UK and evaluate differences in refractive profiles between contemporary Australian children and historical UK data.
Design: Population-based prospective study.
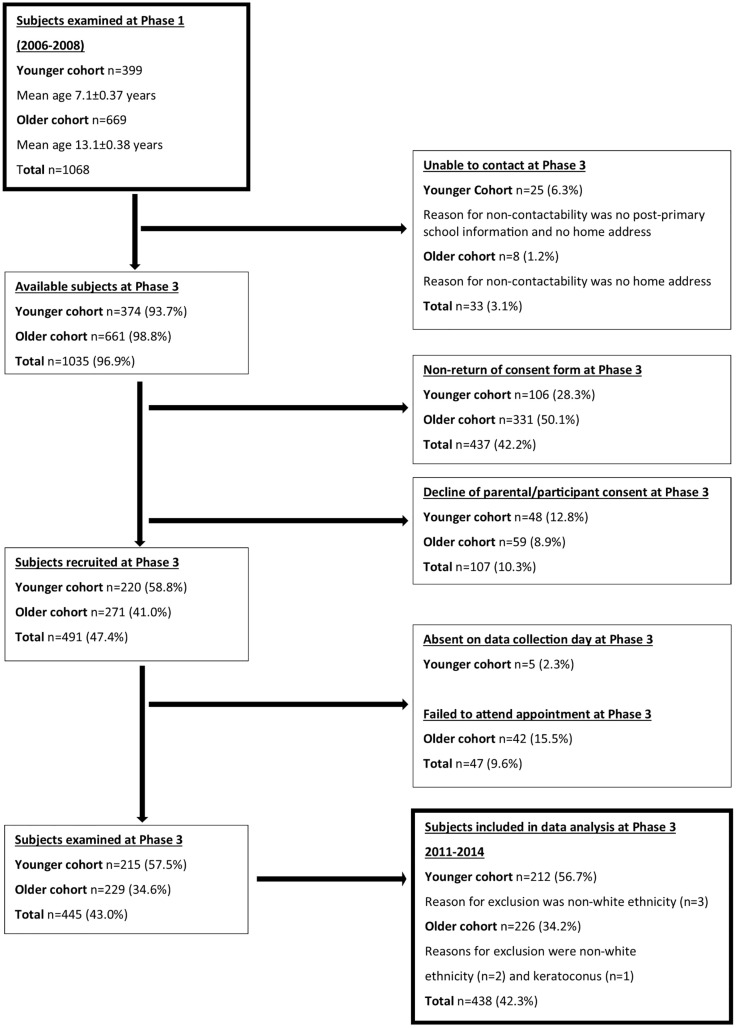
Participants: The Northern Ireland Childhood Errors of Refraction (NICER) study Phase 1 examined 1068 children in two cohorts aged 6-7 years and 12-13 years. Prospective data for six-year follow-up (Phase 3) are available for 212 12-13 year olds and 226 18-20 year olds in each cohort respectively.
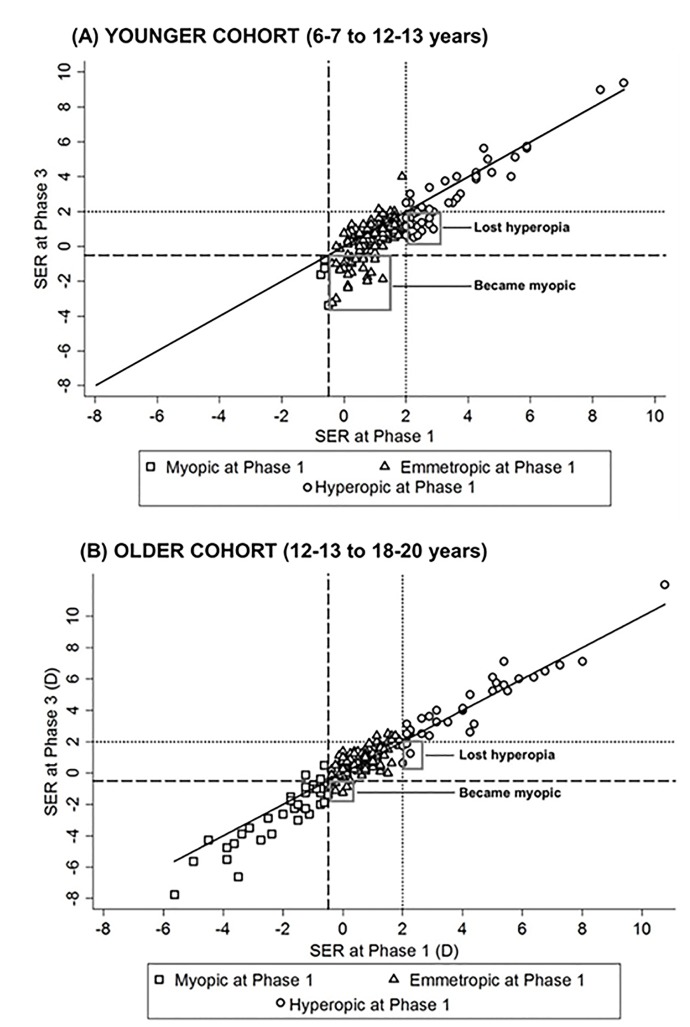
Methods: Cycloplegic refractive error was determined using binocular open-field autorefraction (Shin-Nippon NVision-K 5001, cyclopentolate 1%). Participants were defined by spherical equivalent refraction (SER) as myopic SER ≤-0.50D, emmetropic -0.50D<SER<+2.00 or hyperopic SER≥+2.00D.
Main outcome measures: Proportion and incidence of myopia.
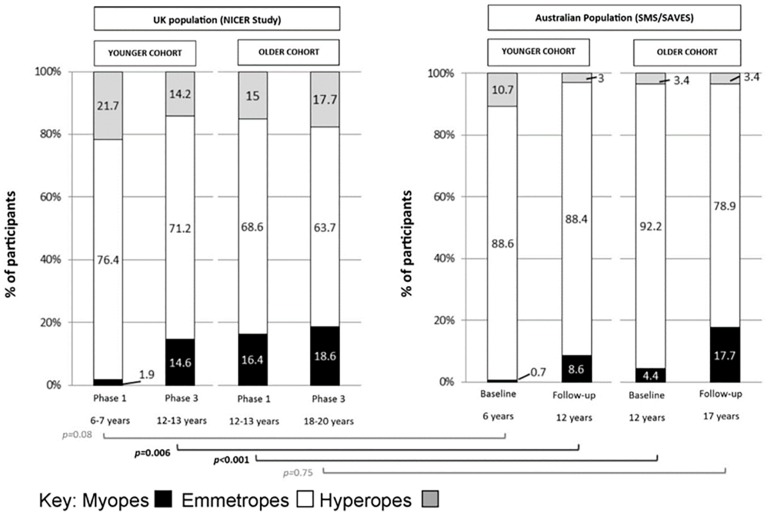
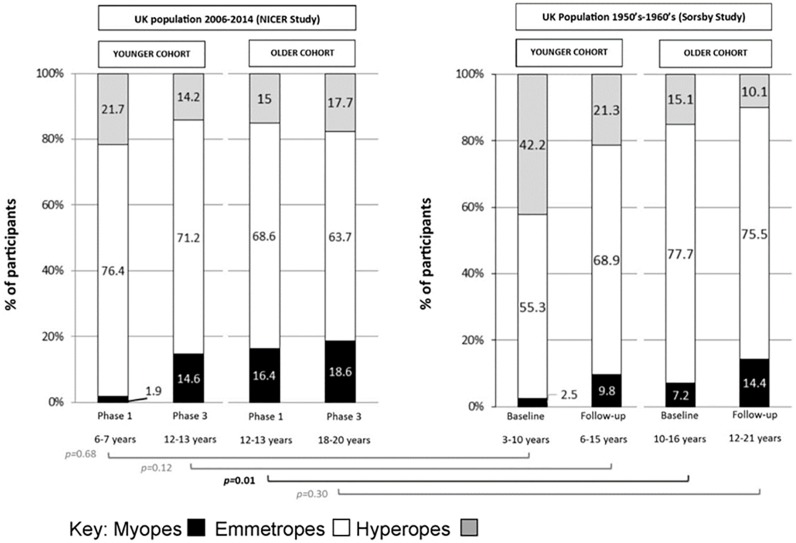
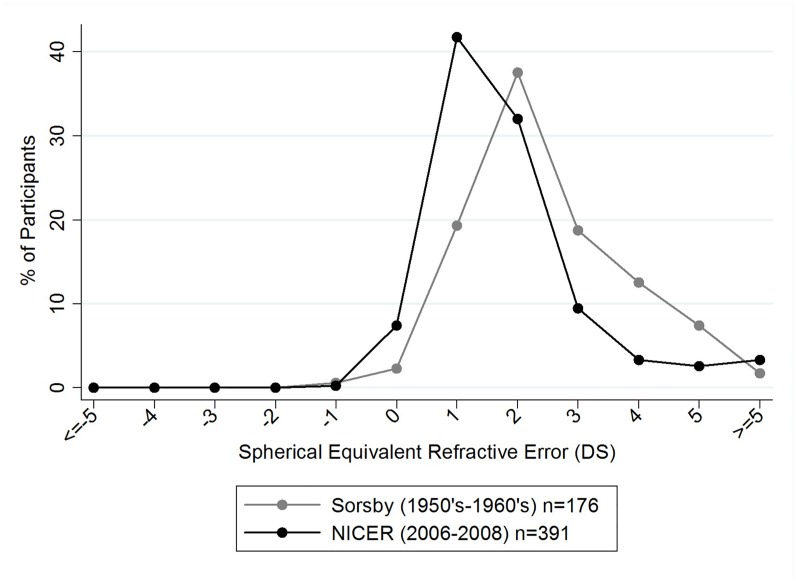
Results: The proportion of myopes significantly increased between 6-7 years (1.9%) and 12-13 years (14.6%) (p<0.001) but not between 12-13 and 18-20 years (16.4% to 18.6%, p = 0.51). The estimated annual incidence of myopia was 2.2% and 0.7% for the younger and older cohorts respectively. There were significantly more myopic children in the UK at age 12-13 years in the NICER study (16.4%) than reported in Australia (4.4%) (p<0.001). However by 17 years the proportion of myopia neared equivalence in the two populations (NICER 18.6%, Australia 17.7%, p = 0.75). The proportion of myopic children aged 12-13 years in the present study (2006-2008) was 16.4%, significantly greater than that reported for children aged 10-16 years in the 1960's (7.2%, p = 0.01). The proportion of hyperopes in the younger NICER cohort decreased significantly over the six year period (from 21.7% to 14.2%, p = 0.04). Hyperopes with SER ≥+3.50D in both NICER age cohorts demonstrated persistent hyperopia.
Conclusions: The incidence and proportion of myopia are relatively low in this contemporary white UK population in comparison to other worldwide studies. The proportion of myopes in the UK has more than doubled over the last 50 years in children aged between 10-16 years and children are becoming myopic at a younger age. Differences between the proportion of myopes in the UK and in Australia apparent at 12-13 years were eliminated by 17 years of age.
Conflict of interest statement
Figures
References
-
- Lin LL, Shih YF, Hsiao CK, Chen CJ. Prevalence of myopia in Taiwanese schoolchildren:1983 to 2000. Ann Acad Med Singapore. 2004; 33(1):27–33. - PubMed
-
- Vitale S, Sperduto RD, Ferris FL III. Increased prevalence of myopia in the United States between 1971–1972 and 1999–2004. Arch Ophthalmol. 2001; 127(12):1632–9. - PubMed
Publication types
MeSH terms
Grants and funding
LinkOut - more resources
Full Text Sources
Other Literature Sources
Medical
