. 2016 Feb;126(2):527-42.
doi: 10.1172/JCI80937. Epub 2016 Jan 19.

TGF-β/β2-spectrin/CTCF-regulated tumor suppression in human stem cell disorder Beckwith-Wiedemann syndrome

TGF-β/β2-spectrin/CTCF-regulated tumor suppression in human stem cell disorder Beckwith-Wiedemann syndrome

Jian Chen et al. J Clin Invest. 2016 Feb.

Abstract

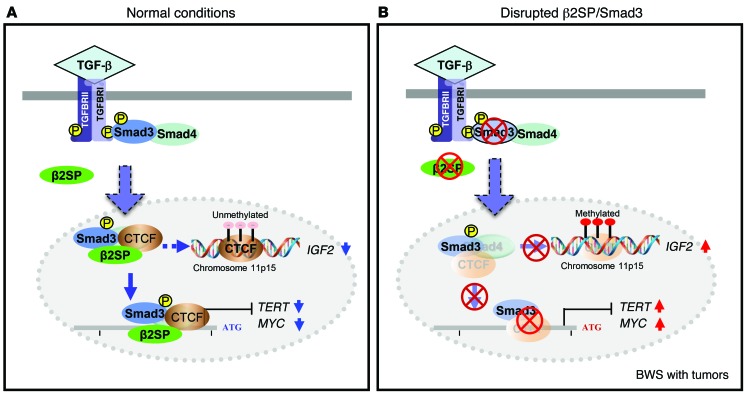
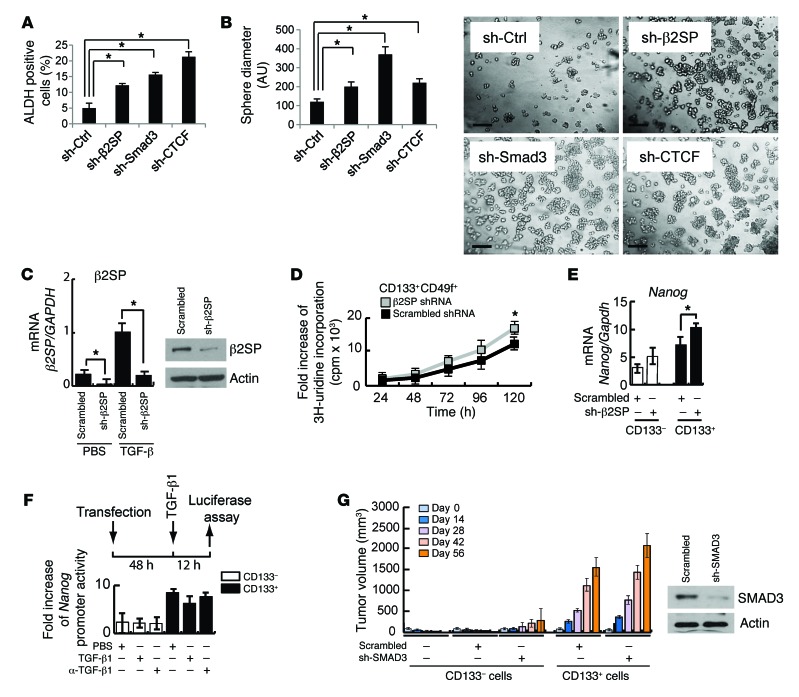
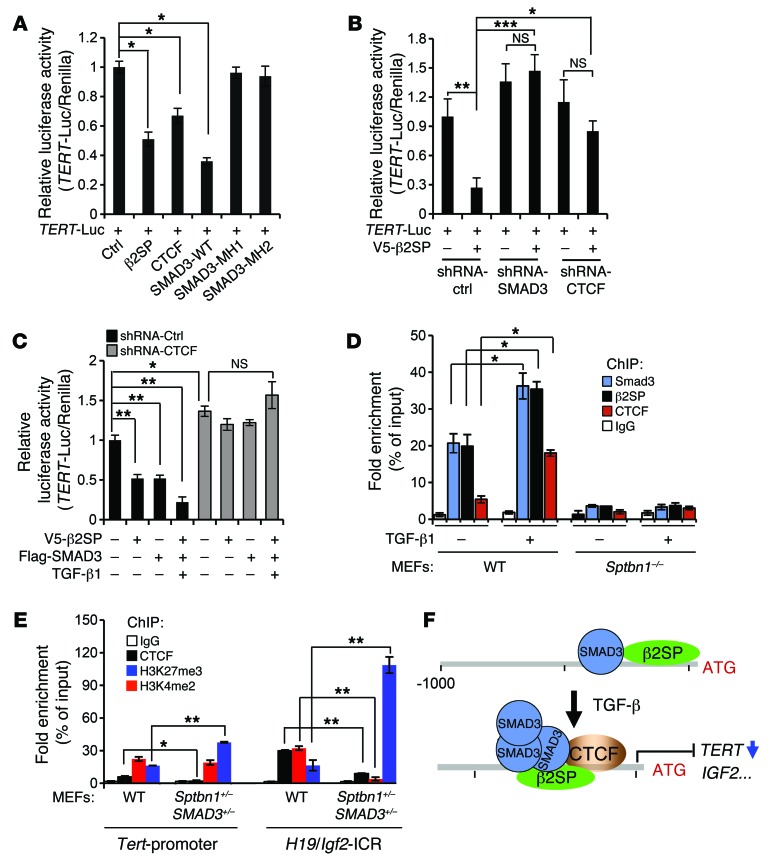
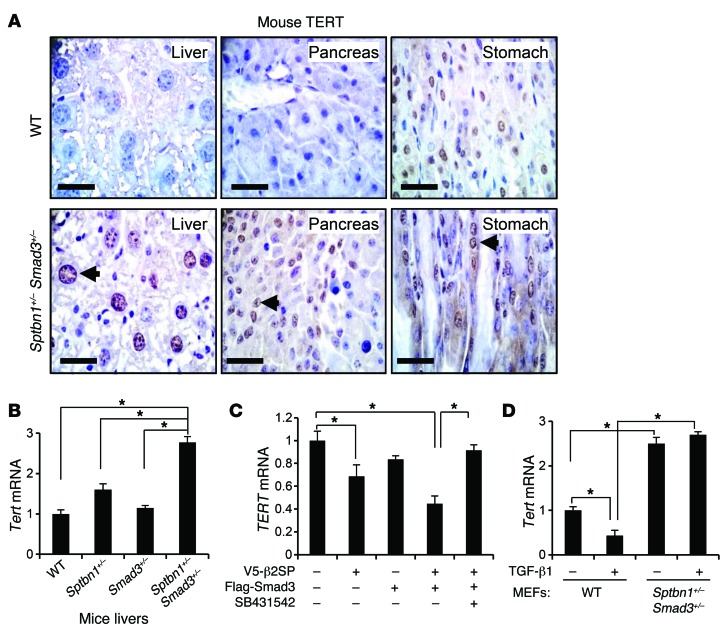
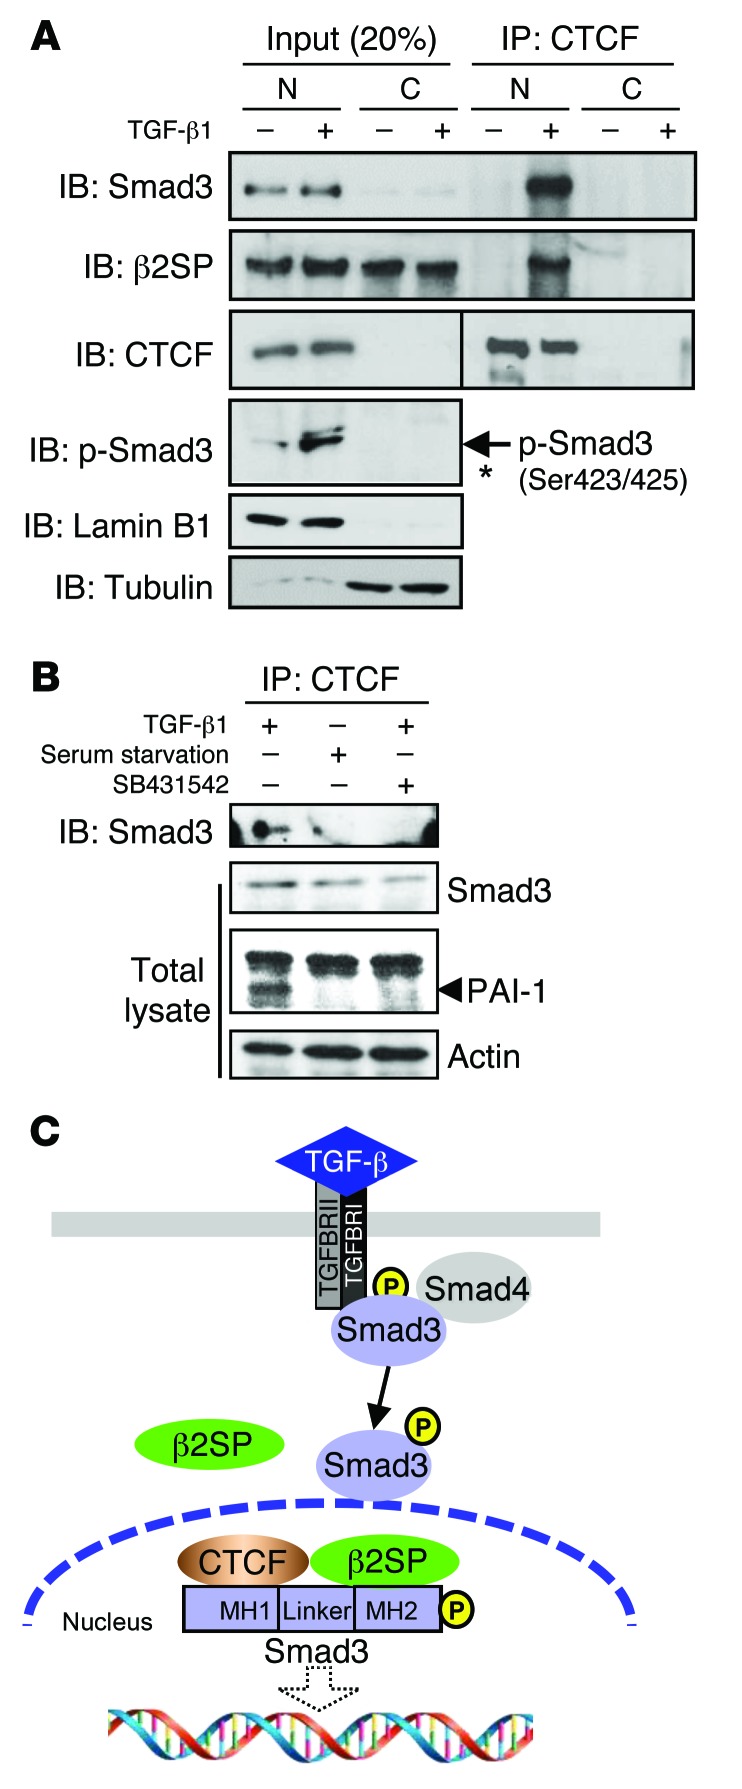
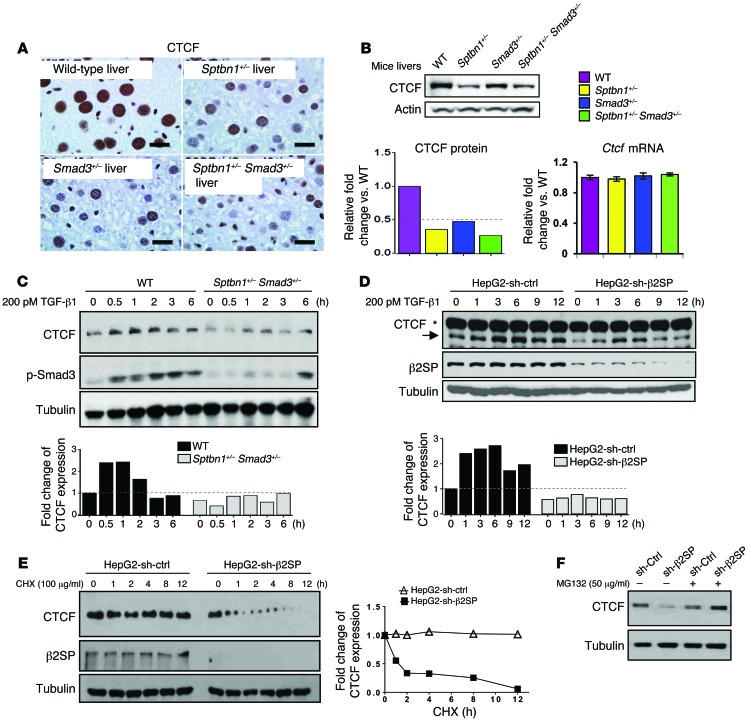
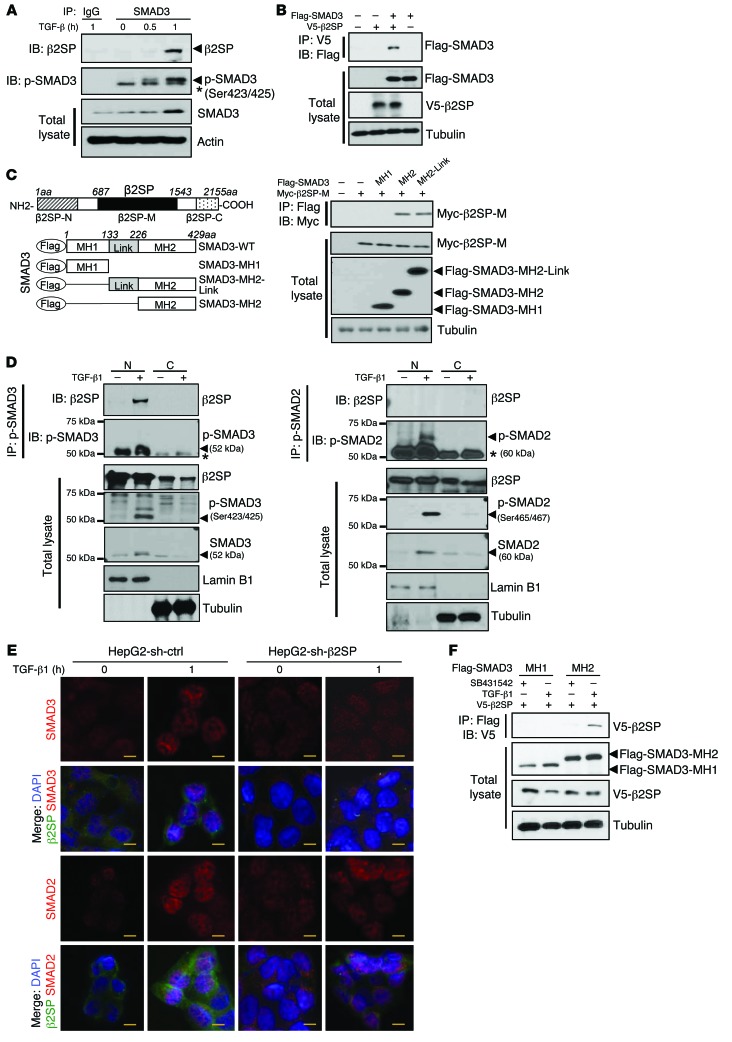
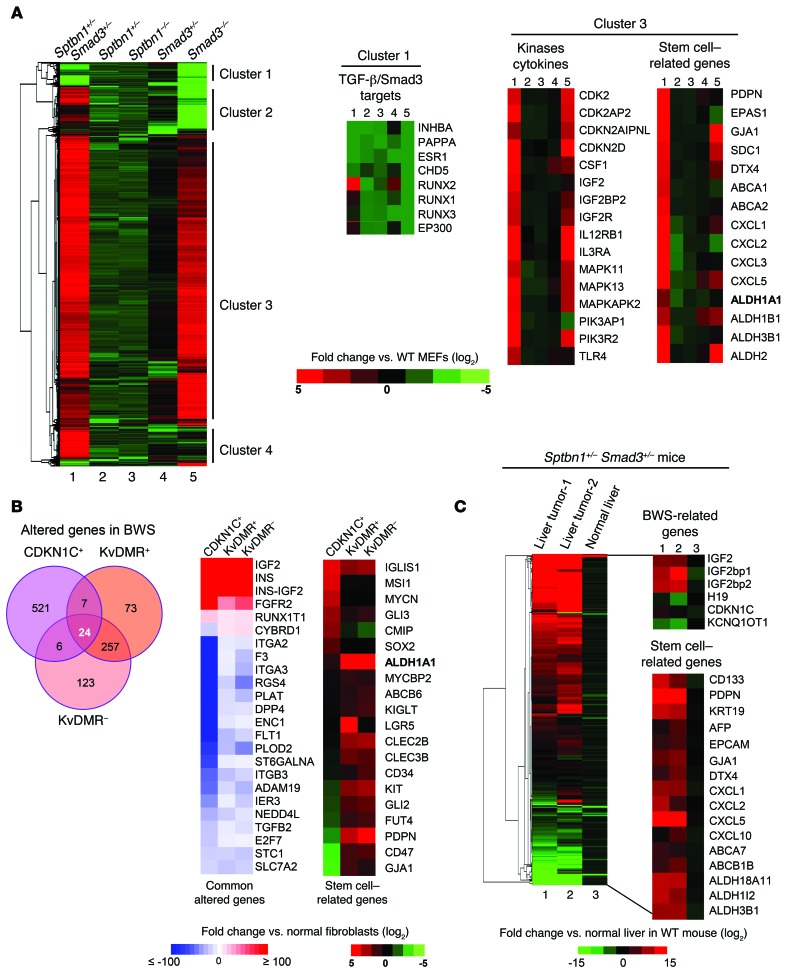
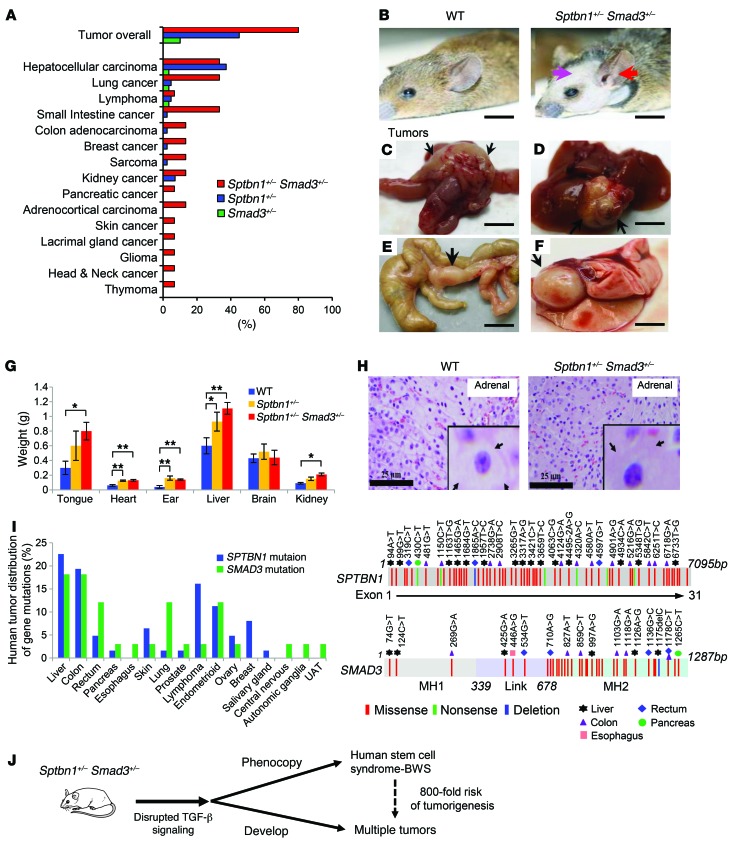
Beckwith-Wiedemann syndrome (BWS) is a human stem cell disorder, and individuals with this disease have a substantially increased risk (~800-fold) of developing tumors. Epigenetic silencing of β2-spectrin (β2SP, encoded by SPTBN1), a SMAD adaptor for TGF-β signaling, is causally associated with BWS; however, a role of TGF-β deficiency in BWS-associated neoplastic transformation is unexplored. Here, we have reported that double-heterozygous Sptbn1+/- Smad3+/- mice, which have defective TGF-β signaling, develop multiple tumors that are phenotypically similar to those of BWS patients. Moreover, tumorigenesis-associated genes IGF2 and telomerase reverse transcriptase (TERT) were overexpressed in fibroblasts from BWS patients and TGF-β-defective mice. We further determined that chromatin insulator CCCTC-binding factor (CTCF) is TGF-β inducible and facilitates TGF-β-mediated repression of TERT transcription via interactions with β2SP and SMAD3. This regulation was abrogated in TGF-β-defective mice and BWS, resulting in TERT overexpression. Imprinting of the IGF2/H19 locus and the CDKN1C/KCNQ1 locus on chromosome 11p15.5 is mediated by CTCF, and this regulation is lost in BWS, leading to aberrant overexpression of growth-promoting genes. Therefore, we propose that loss of CTCF-dependent imprinting of tumor-promoting genes, such as IGF2 and TERT, results from a defective TGF-β pathway and is responsible at least in part for BWS-associated tumorigenesis as well as sporadic human cancers that are frequently associated with SPTBN1 and SMAD3 mutations.


Figures

Figure 9
Figure 9. Schematic model of disrupted TGF-β signaling and BWS tumorigenesis.
(A) The model demonstrates that, under normal conditions, β2SP is an essential SMAD3 adaptor protein required for key events in the propagation of TGF-β signaling and docking SMAD3 and CTCF to DNA, thus either affecting chromosome 11p15-imprinted IGF2 genes or directly suppressing TERT and MYC transcription. (B) In human BWS, disruption of β2SP signaling through an aberrant interaction of β2SP/SMAD3/CTCF in the cell nucleus results in increased expression of IGF2 from chromosome 11p15 and directly activates TERT and MYC transcription, causing large organs and multiple cancers in patients with BWS.
Figure 8
Figure 8. Dysfunction of the β2SP/SMAD3/CTCF complex increases stem-like properties and promotes TIC tumorigenesis.
(A) Increased ALDH population in β2SP, SMAD3, or CTCF knockdown cells. The positive ALDH cells were isolated from HepG2–sh-Ctrl, HepG2–sh-β2SP, HepG2–sh-SMAD3, or HepG2–sh-CTCF cells and then measured by flow cytometry. Bar graph data represent percentages of ALDH-positive cells. *P < 0.001, 1-way ANOVA with post-hoc Bonferroni’s test. (B) Knockdown of β2SP, SMAD3, or CTCF increases sphere formation. HepG2–sh-Ctrl, HepG2–sh-β2SP, HepG2–sh-SMAD3, or HepG2–sh-CTCF cells were cultured in serum-free DMEM/F12 medium with growth factors (10 ng/ml of EGF and FGF) for 6 days. Quantification of the spheres is shown. *P < 0.001, 1-way ANOVA with post-hoc Bonferroni’s test. Representative images of spheres were taken at day 6. Scale bars: 5 μm. (C) β2SP knockdown efficiency is shown in CD133+CD49f+ TICs isolated from liver tumors of alcohol-fed HCV Ns5a Tg mice. β2SP protein levels are effectively silenced by transduction of lentiviral shRNA in TICs (insets). *P < 0.01, Student’s t test. (D) β2SP knockdown increases CD133+CD49f+ TIC proliferation. Cell proliferation rates were determined by measuring 3H-uridine incorporation. *P < 0.05, Student’s t test (vs. scrambled control). (E) β2SP knockdown increases Nanog expression levels in CD133+ TICs. The mRNA expression levels of Nanog were measured by Q-PCR. *P < 0.05, Student’s t test. (F) Nanog promoter activity is higher in CD133+ TICs, while TGF-β stimulation does not significantly inhibit Nanog promoter activity in these TICs. Nanog promoter luciferase assays were performed. (G) SMAD3 knockdown enhanced subcutaneous tumor growth of TICs in a xenograft NOG mouse model. SMAD3 protein levels are effectively silenced by transduction of lentiviral shRNA in TICs (insets). Error bars are shown as SD. Each result shown is representative of 3 independent experiments (AG).
Figure 7
Figure 7. β2SP/SMAD3/CTCF complex transcriptionally regulates TERT.
(A) β2SP decreases TERT transcriptional activity. A luciferase reporter containing TERT promoter region (–1,000 base pairs) was cotransfected with indicated plasmids into SNU398 cells. *P < 0.001, 1-way ANOVA with post-hoc Bonferroni’s test. (n = 3). (B) β2SP regulates TERT transcriptional activity through SMAD3 and/or CTCF. HepG2–sh-Ctrl, HepG2–sh-SMAD3, or HepG2–sh-CTCF cells were cotransfected with indicated plasmids. *P < 0.05; **P < 0.01; ***P < 0.001, 1-way ANOVA with post-hoc Bonferroni’s test. (n = 3). (C) CTCF is required for TGF-β/β2SP/SMAD3-mediated TERT transcriptional activity. HepG2–sh-Ctrl or HepG2–sh-CTCF cells were cotransfected with indicated plasmids. Cells were treated with 200 pM TGF-β1 for 2 hours. *P < 0.05; **P < 0.001, 1-way ANOVA with post-hoc Bonferroni’s test. (n = 3). (D) Binding ability of SMAD3 and CTCF on the TERT promoter region is β2SP dependent. ChIP assays were performed. *P < 0.001 versus indicated, 1-way ANOVA with post-hoc Bonferroni’s test. (n = 3). (E) Decreased binding abilities of CTCF, H3K27me3, and increased binding abilities of H3k4me2 on the Tert and Igf2 promoter regions were observed in Sptbn1+/– Smad3+/– MEFs. *P < 0.05; **P < 0.001, 1-way ANOVA with post-hoc Bonferroni’s test. (n = 3). Error bars are shown as SD. (F) Proposed model of the role of the β2SP/SMAD3/CTCF complex in the regulation of TERT transcriptional activity.
Figure 6
Figure 6. Increased TERT levels in Sptbn1+/– Smad3+/– mice.
(A) Increased levels of TERT in liver, pancreas, and stomach of Sptbn1+/– Smad3+/– mice were observed. Representative immunohistochemical staining of mouse TERT in wild-type or Sptbn1+/– Smad3+/– mouse organs. The arrows point to increased expression levels of TERT in Sptbn1+/– Smad3+/– mice. Scale bars: 20 μm. (B) Increased mRNA expression levels of Tert in Sptbn1+/–, Smad3+/–, and Sptbn1+/– Smad3+/– mouse livers were observed. *P < 0.001, 1-way ANOVA with post-hoc Bonferroni’s test. (n = 3). (C) β2SP and SMAD3 decrease TERT mRNA expression levels in a TGF-β–dependent manner. SNU398 cells were cotransfected with ectopic V5-β2SP and Flag-SMAD3 for 24 hours. Cells were then treated with 50 μM of TGFBR1 inhibitor SB431542 overnight. *P < 0.01, 1-way ANOVA with post-hoc Bonferroni’s test. (n = 3). (D) Reduction of TGF-β–induced Tert expression levels was observed in wild-type MEFs, but not in Sptbn1+/– Smad3+/– MEFs. Cells were treated with 200 pM TGF-β for 2 hours. Tert mRNA levels were detected by Q-PCR. *P < 0.001, 1-way ANOVA with post-hoc Bonferroni’s test. (n = 3). Error bars are shown as SD.
Figure 5
Figure 5. β2SP/SMAD3 interact with CTCF in cell nucleus.
(A) CTCF interacts with β2SP/SMAD3 in cell nucleus. HepG2 cells were treated with 200 pM TGF-β for 2 hours. Cell lysates were isolated as nuclear (N) and cytoplasmic (C) compartments and were immunoprecipitated (IP) with a CTCF antibody and immunoblotted (IB) with indicated antibodies. Asterisk designates nonspecific bands. (B) The interaction of CTCF and SMAD3 is TGF-β dependent. SNU398 cells were cotransfected with the indicated plasmids and were cultured with serum-free medium or treated with 5 μm SB431542 overnight. Then cells were treated with 200 pM TGF-β1 for 2 hours and cell lysates were immunoprecipitated with a CTCF antibody. Data are representative of 2 (A), and 3 (B) independent experiments. (C) Proposed model of the complex of β2SP/SMAD3/CTCF in the cell nucleus responding to TGF-β.
Figure 4
Figure 4. TGF-β/SMAD3/β2SP upregulates CTCF.
(A) Decreased CTCF levels in Sptbn1+/–, Smad3+/–, and Sptbn1+/– Smad3+/– mouse livers were observed. CTCF levels were detected by immunohistochemical analysis in wild-type, Sptbn1+/–, Smad3+/–, and Sptbn1+/– Smad3+/– mouse livers. Scale bars: 20 μm. (B) CTCF protein expression levels but not mRNA levels were decreased in Sptbn1+/–, Smad3+/–, and Sptbn1+/– Smad3+/– mouse livers. CTCF protein levels were detected by immunoblotting analysis. Ctcf mRNA levels were detected by Q-PCR. Error bars are shown as SD. (C and D) TGF-β increased CTCF protein expression levels in Sptbn1+/– Smad3+/– MEFs (C) and in β2SP-knockdown HepG2 cells (D). MEFs or HepG2 cells were treated with 200 pM TGF-β1 for the indicated times. Cell lysates were immunoblotted with the indicated antibodies. The density of CTCF and the integrated optical density were measured. Asterisk designates nonspecific bands. (E) Knockdown β2SP decreased CTCF protein stability. HepG2–sh-Ctrl or HepG2–sh-β2SP cells were treated with 100 μg/ml cycloheximide (CHX) for the indicated times. The density of CTCF and the integrated optical density were measured. The turnover of CTCF is indicated graphically. (F) β2SP-mediated CTCF downregulation was proteasome dependent. HepG2–sh-Ctrl or HepG2–sh-β2SP cells were treated with or without 50 μg/ml MG132 for 6 hours. Cell lysates were immunoblotted with CTCF antibodies. Data are representative of 3 (BE) and 2 (F) independent experiments.
Figure 3
Figure 3. β2SP is required for SMAD3 nuclear translocation in BWS cells.
(A) Interaction of β2SP and SMAD3 is TGF-β dependent. HepG2 cells were treated with 200 pM TGF-β1 for the indicated times. Cell lysates were immunoprecipitated with a SMAD3 antibody and immunoblotted with the indicated antibodies. Asterisk designates nonspecific bands. (B) β2SP interacts with SMAD3. SNU398 cells were cotransfected with the indicated plasmids. Cell lysates were immunoprecipitated with a V5 antibody and immunoblotted with indicated antibodies. (C) β2SP interacts with SMAD3 MH2 domain. SNU398 cells were cotransfected with indicated plasmids. Cell lysates were immunoprecipitated with a Myc antibody and immunoblotted with indicated antibodies. (D) Interaction of β2SP and p-SMAD3 in cell nucleus. Cell lysates were isolated as nuclear (N) and cytoplasmic (C) compartments. HepG2 cells were treated with 200 pM TGF-β for 2 hours. Cell lysates were immunoprecipitated with a p-SMAD3 antibody or a p-SMAD2 antibody and immunoblotted with indicated antibodies. Asterisk designates IgG heavy chain bands. (E) Knockdown of β2SP compromises TGF-β–induced SMAD3, but not SMAD2, nuclear translocation. HepG2 shRNA control cells and shRNA-β2SP stable cells were treated with 200 PM TGF-β for 1 hour. Immunofluorescent staining was performed to detect β2SP, SMAD3, or SMAD2. Scale bars: 40 μm. (F) TGFBR1 inhibitor SB431542 blocks the interaction of β2SP and SMAD3. SNU398 cells were cotransfected with indicated plasmids and were treated with 5 μM TGFBR1 inhibitor SB431542 overnight. Cell lysates were immunoprecipitated with a Flag antibody and immunoblotted with indicated antibodies. Data are representative of 3 (A, B, and D), 2 (C), and 1 (F) independent experiments.
Figure 2
Figure 2. Disruption of TGF-β pathway in Sptbn1+/– Smad3+/– mice and BWS cells.
(A) Heat map comparisons of gene-expression profiles from MEFs from Sptbn1+/– Smad3+/–, Smad3+/–, Sptbn1+/–, Smad3–/–, and Sptbn1–/– versus wild-type MEFs. The mRNA alterations were classified by hierarchical clustering. Representative gene expressions in cluster 1 and cluster 3 are shown (cutoff, P < 0.05). (B) Common altered genes and stemness profiles in the 3 BWS cell lines CDKN1C+, KvDMR+, and KvDMR. Whole-transcriptome RNA sequencing data of BWS cell lines were analyzed by IPA (cutoff, q value < 0.3). The Venn diagram shows the altered genes in BWS cells (left panel). Twenty-four commonly altered genes are presented on a heat map (right panel). (C) The expression of BWS- and stem cell–associated genes in mouse liver tumors. Two spontaneous liver tumors from 2 individual Sptbn1+/– Smad3+/– mice, normal liver tissue from an Sptbn1+/– Smad3+/– mouse, and normal liver tissue from a wild-type mouse were used for whole-transcriptome RNA sequencing analyses, and the data are displayed as a heat map comparing the gene-expression profiles: liver tumor-1, liver tumor-2, and normal liver from Sptbn1+/– Smad3+/– mice versus normal liver from wild-type mice. The mRNA alterations were classified by hierarchical clustering.
Figure 1
Figure 1. Sptbn1+/– Smad3+/– mice develop multiple tumors and phenocopy features of BWS.
(A) Tumor incidence in double Sptbn1+/– Smad3+/– (n = 15) and in single Sptbn1+/– (n = 43) and Smad3+/– (n = 30) mice. (B) Anterior linear ear lobe crease (red arrow) and frontal balding (pink arrow) are nontumorigenic hallmarks of BWS. Sptbn1+/– Smad3+/–mice spontaneously develop multiple primary cancers (black arrows) by 12 months of age, including (C) colon adenocarcinoma, (D) hepatocellular carcinoma, (E) small bowel adenocarcinoma, and (F) lung adenocarcinoma. Scale bars: 10 mm. (G) Enlargement of organs in Sptbn1+/– Smad3+/– mice at 4 months of age. Error bars are shown as SD. n = 3. *P < 0.05; **P < 0.01, 1-way ANOVA with post-hoc Bonferroni’s test. (H) H&E-stained sections reveal adrenal cytomegaly in the fetal adrenal cortex of mutant Sptbn1+/– Smad3+/– mice not seen in wild-type mice. The arrows point to an adrenal cortical cell with enlarged granular eosinophilic cytoplasm and large hyperchromatic nuclei in Sptbn1+/– Smad3+/– mice compared with wild-type mice. Scale bars: 25 μm; original magnification, ×60 (insets). (I) Somatic mutations in SPTBN1 and SMAD3 occur frequently in multiple human cancers. The contribution of tumor types (left panel) and the location of somatic mutations (right panel) were summarized on the basis of the data set from COSMIC. (J) The diagram shows that Sptbn1+/– Smad3+/– mice phenocopy features of BWS and develop multiple tumors.

References

    1. Pettenati MJ, Haines JL, Higgins RR, Wappner RS, Palmer CG, Weaver DD. Wiedemann-Beckwith syndrome: presentation of clinical and cytogenetic data on 22 new cases and review of the literature. Hum Genet. 1986;74(2):143–154. doi: 10.1007/BF00282078. - DOI - PubMed
    1. Weksberg R, Shuman C, Beckwith JB. Beckwith-Wiedemann syndrome. Eur J Hum Genet. 2010;18(1):8–14. doi: 10.1038/ejhg.2009.106. - DOI - PMC - PubMed
    1. DeBaun MR, Tucker MA. Risk of cancer during the first four years of life in children from The Beckwith-Wiedemann Syndrome Registry. J Pediatr. 1998;132(3 pt 1):398–400. - PubMed
    1. Hadzic N, Finegold MJ. Liver neoplasia in children. Clin Liver Dis. 2011;15(2):443–462. doi: 10.1016/j.cld.2011.03.011. - DOI - PubMed
    1. Keller RB, Demellawy DE, Quaglia A, Finegold M, Kapur RP. Methylation status of the chromosome arm 19q MicroRNA cluster in sporadic and androgenetic-biparental mosaicism-associated hepatic mesenchymal hamartoma. Pediatr Dev Pathol. 2015;18(3):218–227. doi: 10.2350/15-01-1600-OA.1. - DOI - PubMed

Publication types

MeSH terms

Substances