

Establishment of Elevated Serum Levels of IL-10, IL-8 and TNF-β as Potential Peripheral Blood Biomarkers in Tubercular Lymphadenitis: A Prospective Observational Cohort Study
- PMID: 26784906
- PMCID: PMC4718686
- DOI: 10.1371/journal.pone.0145576
Establishment of Elevated Serum Levels of IL-10, IL-8 and TNF-β as Potential Peripheral Blood Biomarkers in Tubercular Lymphadenitis: A Prospective Observational Cohort Study
Abstract
Background: Tubercular lymphadenitis (TL) is the most common form of extra-pulmonary tuberculosis (TB) consisting about 15-20% of all TB cases. The currently available diagnostic modalities for (TL), are invasive and involve a high index of suspicion, having limited accuracy. We hypothesized that TL would have a distinct cytokine signature that would distinguish it from pulmonary TB (PTB), peripheral tubercular lymphadenopathy (LNTB), healthy controls (HC), other lymphadenopathies (LAP) and cancerous LAP. To assess this twelve cytokines (Tumor Necrosis Factor (TNF)-α, Interferon (IFN) -γ, Interleukin (IL)-2, IL-12, IL-18, IL-1β, IL-10, IL-6, IL-4, IL-1Receptor antagonist (IL-1Ra), IL-8 and TNF-β, which have a role in pathogenesis of tuberculosis, were tested as potential peripheral blood biomarkers to aid the diagnosis of TL when routine investigations prove to be of limited value.
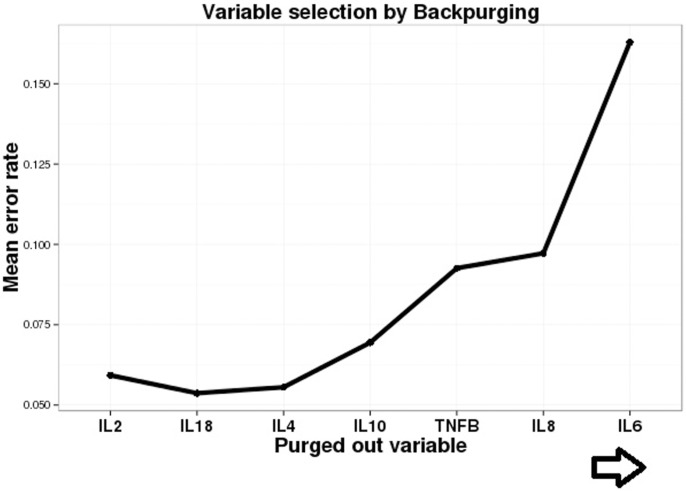
Methods and findings: A prospective observational cohort study carried out during 2010-2013. This was a multi-center study with three participating hospitals in Delhi, India where through random sampling cohorts were established. The subjects were above 15 years of age, HIV-negative with no predisposing ailments to TB (n = 338). The discovery cohort (n = 218) had LNTB (n = 50), PTB (n = 84) and HC (n = 84). The independent validation cohort (n = 120) composed of patients with cancerous LAP (n = 35), other LAP (n = 20) as well as with independent PTB (n = 30), LNTB (n = 15) and HC (n = 20). Eight out of twelve cytokines achieved statistical relevance upon evaluation by pairwise and ROC analysis. Further, variable selection using random forest backward elimination revealed six serum biosignatures including IL-12, IL-4, IL-6, IL-10, IL-8 and TNF-β as optimal for classifying the LNTB status of an individual. For the sake of clinical applicability we further selected a three analyte panel (IL-8, IL-10 and TNF-β) which was subjected to multinomial modeling in the independent validation cohort which was randomised into training and test cohorts, achieving an overwhelming 95.9% overall classifying accuracy for correctly classifying LNTB cases with a minimal (7%) misclassification error rate in the test cohort.
Conclusions: In our study, a three analyte serum biosignatures and probability equations were established which can guide the physician in their clinical decision making and step wise management of LNTB patients. This set of biomarkers has the potential to be a valuable adjunct to the diagnosis of TL in cases where AFB positivity and granulomatous findings elude the clinician.
Conflict of interest statement
Figures


Similar articles
-
Relationship between circulating levels of IFN-gamma, IL-10, CXCL9 and CCL2 in pulmonary and extrapulmonary tuberculosis is dependent on disease severity.Scand J Immunol. 2009 Mar;69(3):259-67. doi: 10.1111/j.1365-3083.2008.02217.x. Scand J Immunol. 2009. PMID: 19281538
-
Diagnostic accuracy of cytokine levels (TNF-alpha, IL-2 and IFN-gamma) in bronchoalveolar lavage fluid of smear-negative pulmonary tuberculosis patients.Respiration. 2008;75(1):73-8. doi: 10.1159/000110744. Epub 2007 Nov 1. Respiration. 2008. PMID: 17975298
-
Diminished circulating plasma and elevated lymph node culture supernatant levels of IL-10 family cytokines in tuberculous lymphadenitis.Cytokine. 2018 Nov;111:511-517. doi: 10.1016/j.cyto.2018.05.027. Epub 2018 Jun 2. Cytokine. 2018. PMID: 29871780 Free PMC article.
-
Enhanced Mycobacterial Antigen-Induced Pro-Inflammatory Cytokine Production in Lymph Node Tuberculosis.Am J Trop Med Hyg. 2019 Jun;100(6):1401-1406. doi: 10.4269/ajtmh.18-0834. Am J Trop Med Hyg. 2019. PMID: 30994092 Free PMC article.
-
Comparative Genetic Association Analysis of Human Genetic Susceptibility to Pulmonary and Lymph Node Tuberculosis.Genes (Basel). 2023 Jan 13;14(1):207. doi: 10.3390/genes14010207. Genes (Basel). 2023. PMID: 36672948 Free PMC article.
Cited by
-
Interleukin-8 Regulates the Autophagy and Apoptosis in Gastric Cancer Cells via Regulating PI3K/Akt Signaling Pathway.Dis Markers. 2022 Aug 11;2022:7300987. doi: 10.1155/2022/7300987. eCollection 2022. Dis Markers. 2022. PMID: 35990250 Free PMC article.
-
HMGB1/RAGE Signaling and Pro-Inflammatory Cytokine Responses in Non-HIV Adults with Active Pulmonary Tuberculosis.PLoS One. 2016 Jul 19;11(7):e0159132. doi: 10.1371/journal.pone.0159132. eCollection 2016. PLoS One. 2016. PMID: 27434276 Free PMC article.
-
Next-Gen Dual Transcriptomics for Adult Extrapulmonary Tuberculosis Biomarkers and Host-Pathogen Interplay in Human Cells: A Strategic Review.Indian J Microbiol. 2024 Mar;64(1):36-47. doi: 10.1007/s12088-023-01143-z. Epub 2023 Dec 14. Indian J Microbiol. 2024. PMID: 38468742 Free PMC article. Review.
-
Reduced systemic and mycobacterial antigen-stimulated concentrations of IL-1β and IL-18 in tuberculous lymphadenitis.Cytokine. 2017 Feb;90:66-72. doi: 10.1016/j.cyto.2016.10.013. Epub 2016 Oct 26. Cytokine. 2017. PMID: 27794266 Free PMC article. Clinical Trial.
-
Factors Influencing the Experience of Breast and Cervical Cancer Screening Among Women in Low- and Middle-Income Countries: A Systematic Review.JCO Glob Oncol. 2023 May;9:e2200359. doi: 10.1200/GO.22.00359. JCO Glob Oncol. 2023. PMID: 37141559 Free PMC article.
References
-
- World Health Organisation. Global tuberculosis report 2014. Available: http://www.who.int/tb/publications/global_report/en/
-
- Sharma SK, Mohan A. Extrapulmonary tuberculosis. Indian J Med Res 2004; 120:316–53. - PubMed
-
- Polesky A, Grove W, Bhatia G. Peripheral tuberculous lymphadenitis: epidemiology, diagnosis, treatment and outcome. Medicine (Baltimore) 2005; 84: 350–62. - PubMed
-
- Fitzgerald D, Sterling TR, Hass DW. Mycobacterium tuberculosis In: Mandell GL, Bennett JE, Dolin R. Principles and practice of infectious diseases 7th ed Vol2 Philadelphia, PA: Churchill Livingstone Press; p3158.
-
- Mohapatra PR, Janmeja AK. Tuberculous Lymphadenitis. J Assoc Physicians India 2009; 57:585–90. - PubMed
Publication types
MeSH terms
Substances
LinkOut - more resources
Full Text Sources
Other Literature Sources
Research Materials
Miscellaneous
