

Standardized Assessment of Biodiversity Trends in Tropical Forest Protected Areas: The End Is Not in Sight
- PMID: 26785119
- PMCID: PMC4718630
- DOI: 10.1371/journal.pbio.1002357
Standardized Assessment of Biodiversity Trends in Tropical Forest Protected Areas: The End Is Not in Sight
Abstract
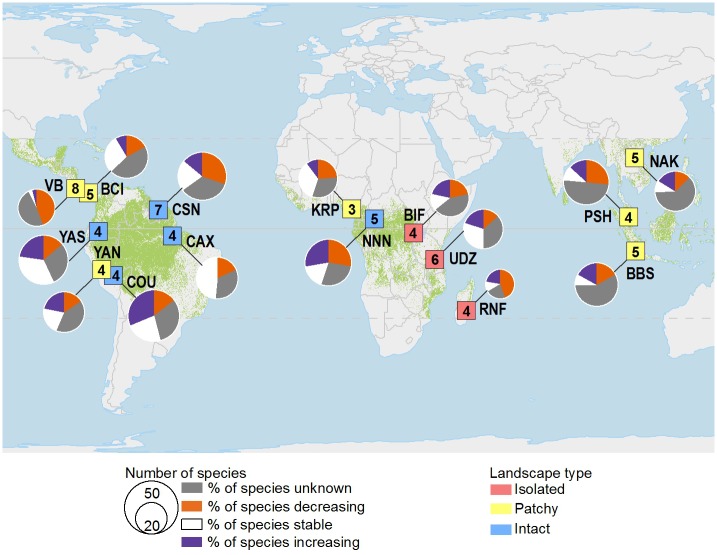
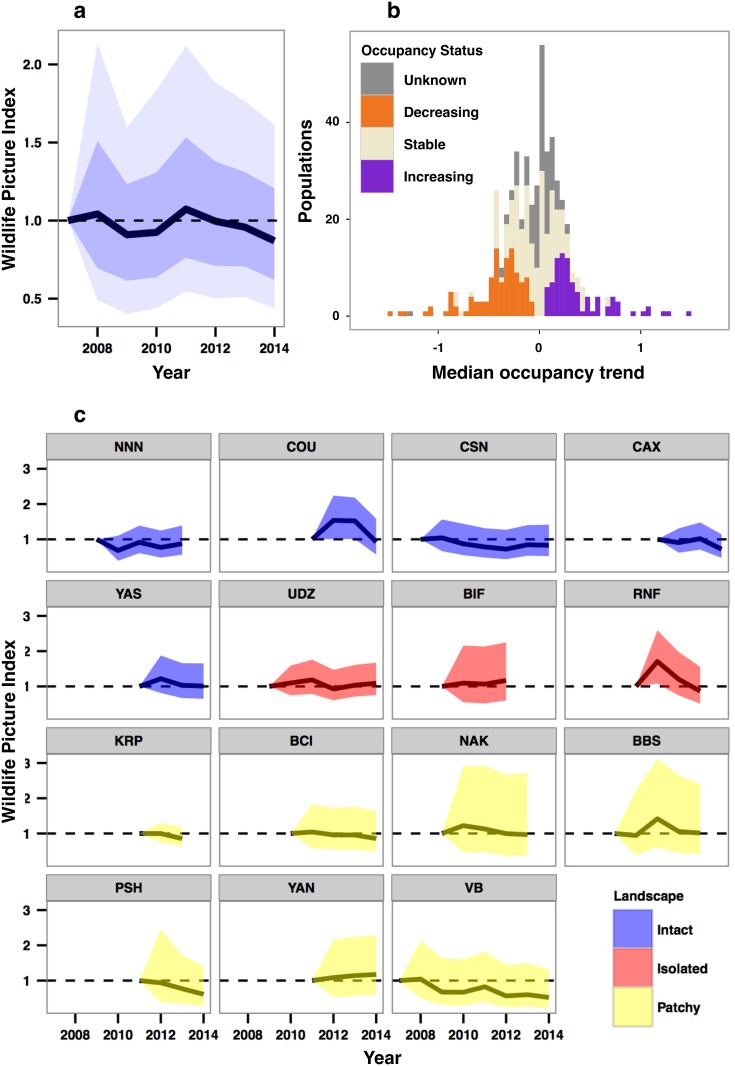
Extinction rates in the Anthropocene are three orders of magnitude higher than background and disproportionately occur in the tropics, home of half the world's species. Despite global efforts to combat tropical species extinctions, lack of high-quality, objective information on tropical biodiversity has hampered quantitative evaluation of conservation strategies. In particular, the scarcity of population-level monitoring in tropical forests has stymied assessment of biodiversity outcomes, such as the status and trends of animal populations in protected areas. Here, we evaluate occupancy trends for 511 populations of terrestrial mammals and birds, representing 244 species from 15 tropical forest protected areas on three continents. For the first time to our knowledge, we use annual surveys from tropical forests worldwide that employ a standardized camera trapping protocol, and we compute data analytics that correct for imperfect detection. We found that occupancy declined in 22%, increased in 17%, and exhibited no change in 22% of populations during the last 3-8 years, while 39% of populations were detected too infrequently to assess occupancy changes. Despite extensive variability in occupancy trends, these 15 tropical protected areas have not exhibited systematic declines in biodiversity (i.e., occupancy, richness, or evenness) at the community level. Our results differ from reports of widespread biodiversity declines based on aggregated secondary data and expert opinion and suggest less extreme deterioration in tropical forest protected areas. We simultaneously fill an important conservation data gap and demonstrate the value of large-scale monitoring infrastructure and powerful analytics, which can be scaled to incorporate additional sites, ecosystems, and monitoring methods. In an era of catastrophic biodiversity loss, robust indicators produced from standardized monitoring infrastructure are critical to accurately assess population outcomes and identify conservation strategies that can avert biodiversity collapse.
Conflict of interest statement
The authors have declared that no competing interests exist.
Figures
References
-
- Terborgh J, Lopez L, Nunez P, Rao M, Shahabuddin G, Orihuela G, et al. Ecological meltdown in predator-free forest fragments. Science. 2001;294(5548):1923–6. ISI:000172465000058. - PubMed
Publication types
MeSH terms
LinkOut - more resources
Full Text Sources
Other Literature Sources
Miscellaneous
