. 2016 Jan 20:7:10384.
doi: 10.1038/ncomms10384.

Bcl-xL promotes metastasis independent of its anti-apoptotic activity

Affiliations

Bcl-xL promotes metastasis independent of its anti-apoptotic activity

Soyoung Choi et al. Nat Commun. .

Abstract

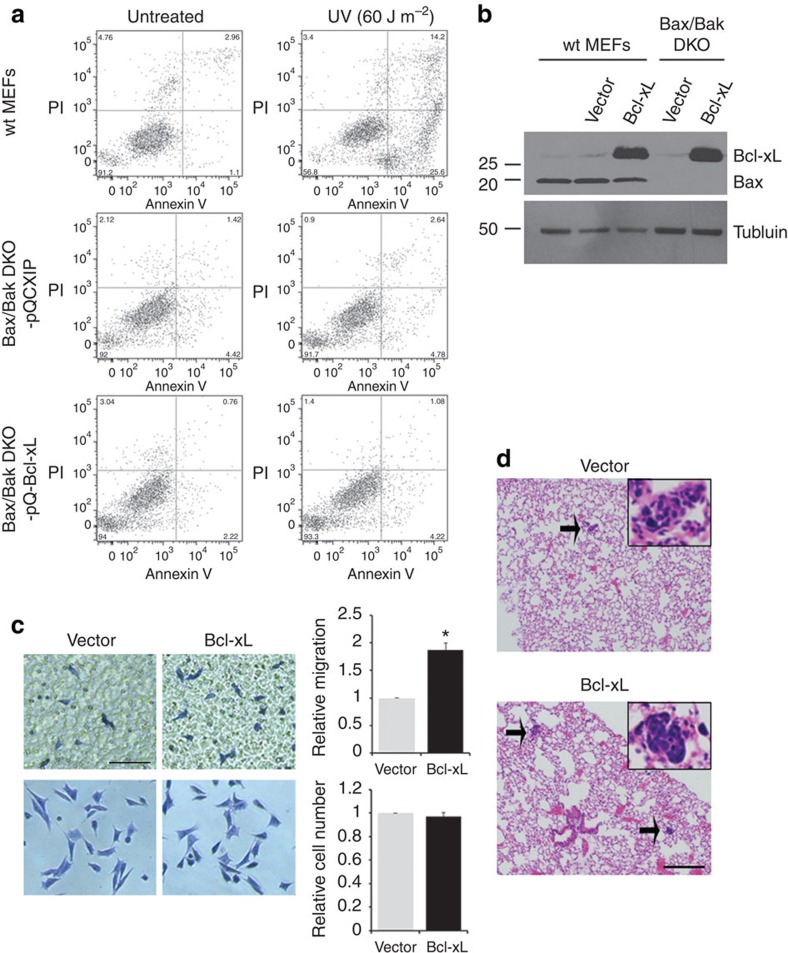
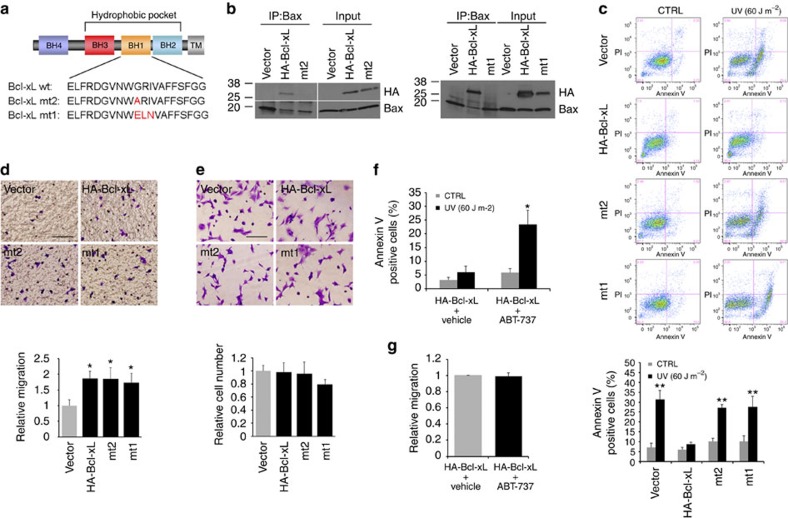
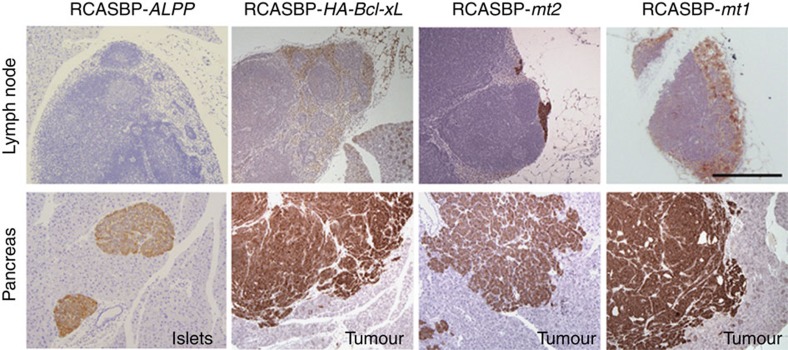
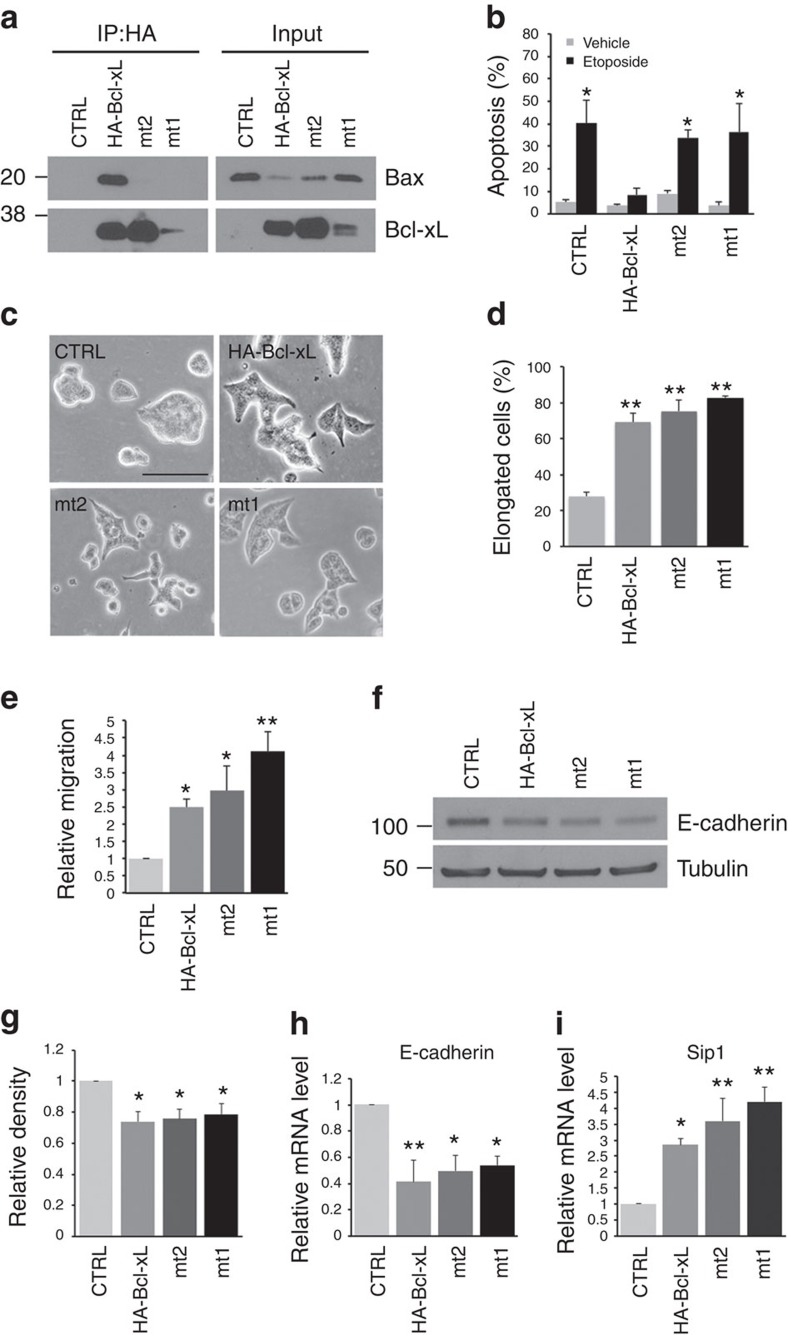
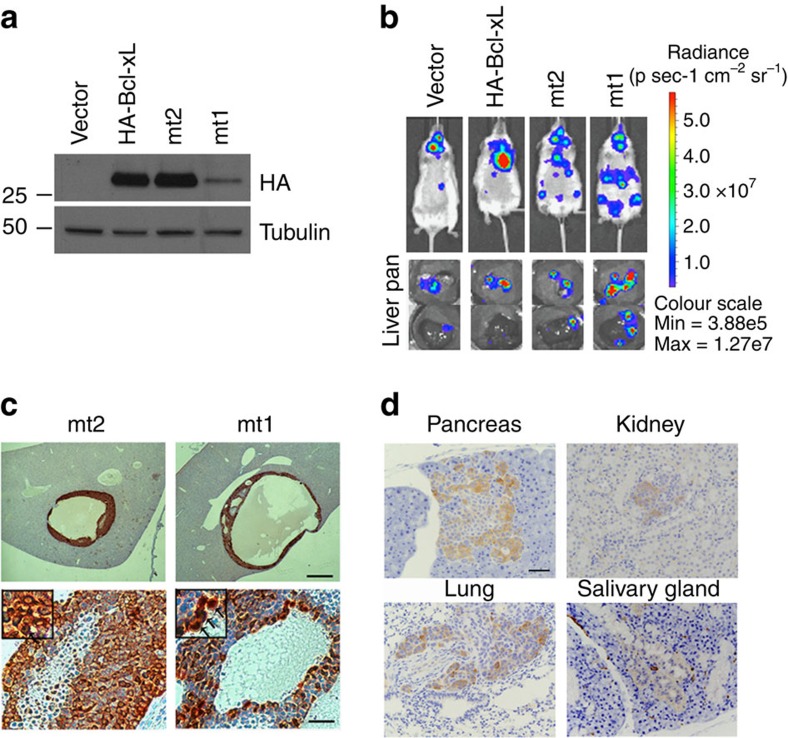
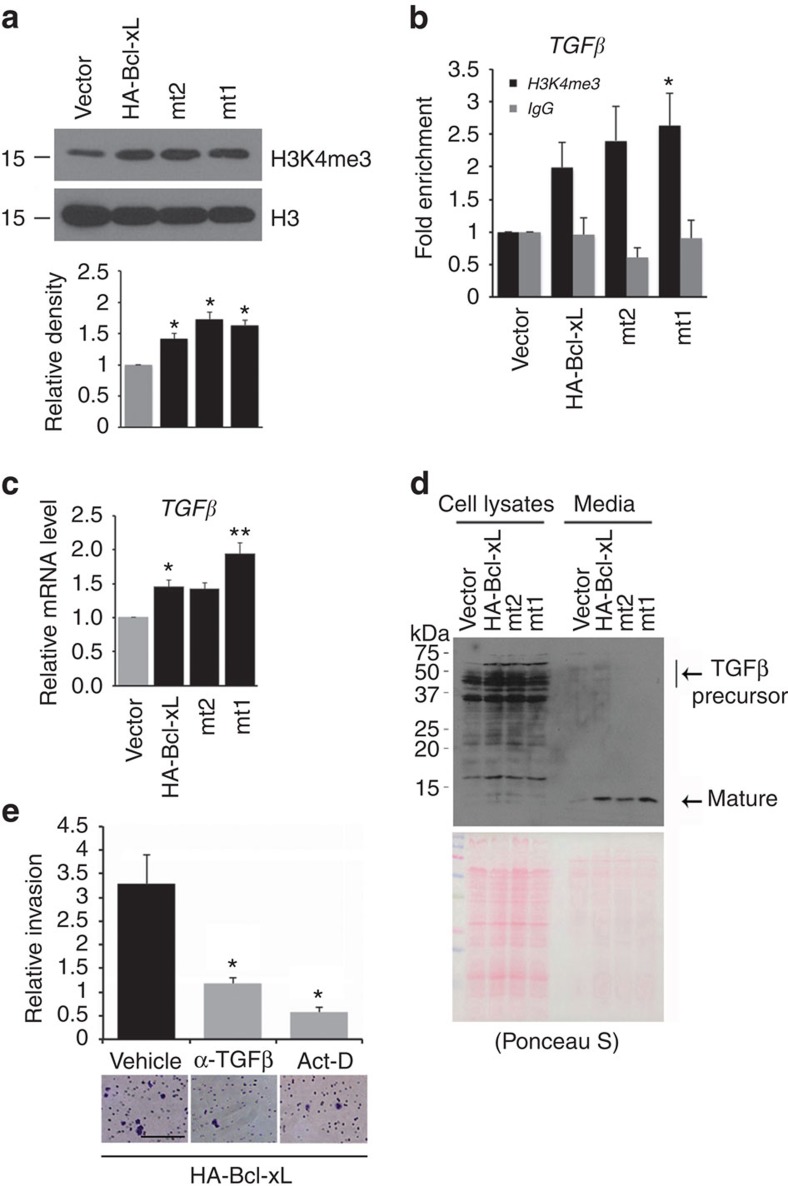
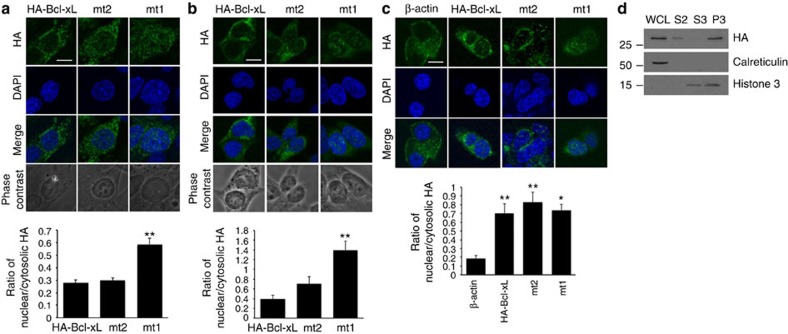
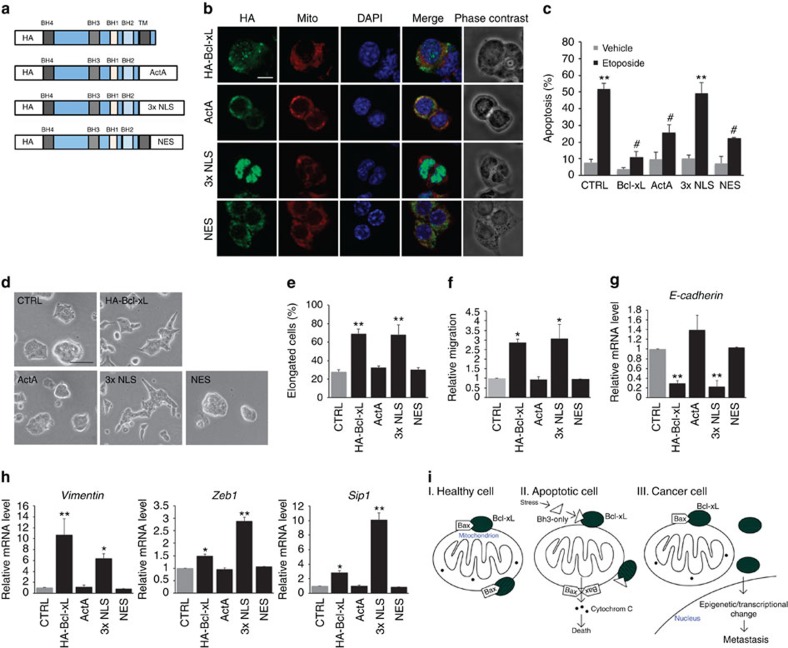
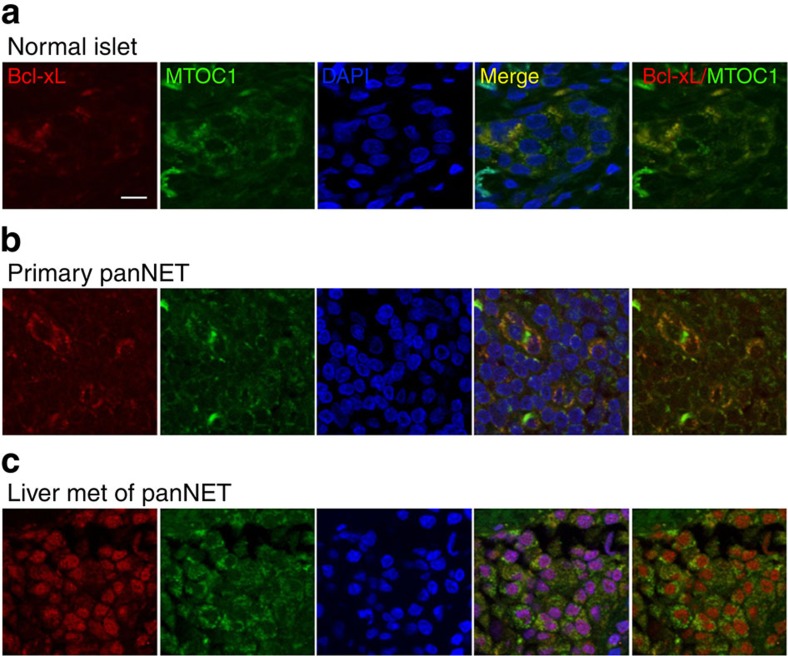
Bcl-xL suppresses mitochondria-mediated apoptosis and is frequently overexpressed in cancer to promote cancer cell survival. Bcl-xL also promotes metastasis. However, it is unclear whether this metastatic function is dependent on its anti-apoptotic activity in the mitochondria. Here we demonstrate that Bcl-xL promotes metastasis independent of its anti-apoptotic activity. We show that apoptosis-defective Bcl-xL mutants and an engineered Bcl-xL targeted to the nucleus promote epithelial-mesenchymal transition, migration, invasion and stemness in pancreatic neuroendocrine tumour (panNET) and breast cancer cell lines. However, Bcl-xL proteins targeted to the mitochondria or outside of the nucleus do not have these functions. We confirm our findings in spontaneous and xenograft mouse models. Furthermore, Bcl-xL exerts metastatic function through epigenetic modification of the TGFβ promoter to increase TGFβ signalling. Consistent with these findings, we detect nuclear Bcl-xL in human metastatic panNETs. Taken together, the metastatic function of Bcl-xL is independent of its anti-apoptotic activity and its residence in the mitochondria.


Figures

Figure 1
Figure 1. Bcl-xL promotes migration in the absence of pro-apoptotic proteins Bax/Bak in MEFs.
(a) Wild-type (wt) MEFs and Bax/Bak DKO MEFs overexpressing control vector (pQCXIP) or Bcl-xL were untreated or treated with 60 J m−2 UV. After 24 h, apoptosis was measured by staining cells with Annexin V and propidium iodide (PI). Only wt MEFs demonstrated the increased Annexin V-positive cells. (b) Western blot analysis for the level of Bcl-xL proteins in wt MEFs and Bax/Bak DKO MEFs overexpressing control vector (pQCXIP) or Bcl-xL. α-tubulin was used a loading control. (c) Migration of Bax/Bak DKO MEFs overexpressing control vector or Bcl-xL was determined using in vitro transwell migration chamber with a serum gradient (2–10%). Overall, 5 × 10⁴ cells were seeded in the upper chambers of the transwell inserts. Four hours later, cells attached on the top of the upper chambers were removed, and the number of cells on the bottom surface of the transwell inserts was counted. Bax/Bak DKO MEFs overexpressing Bcl-xL demonstrated enhanced migration compared with Bax/Bak DKO MEFs overexpressing control vector (top row), and the relative cell numbers between the two cell lines remained the same in a regular cell culture condition (bottom row). Following crystal violet staining, cells were counted from eight randomly picked fields in three independent experiments. Error bars represent s.e.m. *P=0.02 relative to control (vector), two-sided t-test. Scale bar, 100 μm. Original magnification, × 20. (d) Lung sections from mice injected with Bax/Bak DKO MEFs overexpressing control vector or Bcl-xL through lateral tail vein were stained with haematoxylin and eosin. Bax/Bak DKO MEFs overexpressing Bcl-xL developed more micrometastatic foci (arrows) compared with control Bax/Bak DKO MEFs. Scale bar, 200 μm. Original magnification, × 40 for inserted photos.
Figure 2
Figure 2. Bcl-xL mutants that fail to bind to Bax/Bak promotes migration.
(a) Schematic diagram of Bcl-xL constructs. BH, Bcl-2 homology domain; TM, transmembrane domain. (b) Cell lysates of wt MEFs overexpressing control vector, HA-Bcl-xL (wt), HA-Bcl-xL mt2 and HA-Bcl-xL mt1 were subjected to immunoprecipitation with Bax antibody and then followed by western blot analysis to detect HA-Bcl-xL proteins and Bax. Both Bcl-xL mutants (mt2 and mt1) lost the ability to bind Bax in MEFs. (c) wt MEFs overexpressing control vector, HA-Bcl-xL, HA-Bcl-xL-mt2 and HA-Bcl-xL-mt1 were treated with 60-J m−2 UV, and then apoptosis was examined using flow cytometry analysis following Annexin V and PI staining. Only HA-Bcl-xL (wt) prevented UV-induced apoptosis. **P<0.01 relative to vector CTRL. N=4 independent experiments, and error bar represents s.e.m. Data were analysed using ANOVA, followed by Dunnett's post hoc test. (d,e) wt MEFs overexpressing three Bcl-xL constructs (wt-Bcl-xL, mt2 and mt1) increased cell migration compared with wt MEFs overexpressing control vector (d). Migration of cells was determined using in vitro transwell migration chamber, as described in Fig. 1c. The relative cell numbers among the cell lines remained the same in a regular cell culture condition (e). Cells were counted from eight randomly picked fields in five independent experiments in both d,e. *P<0.04 relative to vector alone. Values are means±s.e.m. Data were analysed using ANOVA, followed by Dunnett's post hoc test. Scale bar, 100 μm. Original magnification, × 20. (f) wt MEFs overexpressing HA-Bcl-xL were pretreated with ABT-737 (10 μM) for 2 h before UV (60 J m−2) treatment. After 24 h, apoptosis was measured by staining cells with Annexin V and PI. ABT-737 reversed the anti-apoptotic effect of Bcl-xL. *P<0.05 relative to vehicle-treated HA-Bcl-xL. N=4 independent experiments, and error bar represents s.e.m. Data were analysed using ANOVA, followed by Dunnett's post hoc test. (g) wt MEFs overexpressing HA-Bcl-xL pretreated with 10 μM ABT-737 did not affect the Bcl-xL-mediated cell migration. Migration of cells was determined using in vitro transwell migration chamber, as described in Fig. 1c.
Figure 3
Figure 3. HA-Bcl-xL mutants defective in anti-apoptotic function promote metastasis of primary panNETs in RIP-Tag; RIP-tva mice.
RIP-Tag; RIP-tva mice were infected with the indicated RCASBP retroviruses at 7 weeks of age and killed at 16 weeks of age. Organs were harvested for histological analysis. While mice with RCASBP-ALPP did not develop lymph node metastasis, lymph node metastasis was observed in mice with RCASBP-HA-Bcl-xL, mt2 and mt1. Photographs show representative synaptophysin staining of metastatic panNET in pancreatic lymph nodes (upper panel) and islets or tumours in pancreatic sections (lower panel) of RIP-Tag; RIP-tva mice infected with RCASBP-ALPP, RCASBP-HA-Bcl-xL, mt2 and mt1. Scale bar, 200 μm.
Figure 4
Figure 4. Bcl-xL mutants defective in anti-apoptotic function retain the effect of wt Bcl-xL on cell migration and EMT in the mouse N134 panNET cell line.
(a) Cell lysates were subjected to immunoprecipitation with HA magnetic beads and then followed by western blot analysis to detect Bcl-xL and Bax. Both Bcl-xL mutants (mt2 and mt1) lost the ability to bind to Bax in N134. (b) N134 tumour cells infected with RCASBP-HA-β-actin, HA-Bcl-xL, mt2 and mt1 were treated with 10-μM etoposide for 24 h, and then apoptosis was examined with flow cytometry analysis following Annexin V and PI staining. Only cells infected with HA-Bcl-xL prevented etoposide-induced apoptosis. *P<0.05 relative to CTLR treated with vehicle. Values are means±s.e.m., N=4. Data were analysed using ANOVA from four independent experiments, followed by Dunnett's post hoc test. (c) Bright-field images of N134 tumour cells. Cells infected with RCASBP-HA-Bcl-xL, mt2 or mt1 changed morphology compared with control cells (RCASBP-HA-β-actin). Scale bar, 50 μm. (d) Quantification of the proportion of elongated cells shown in c. Values are means±s.e.m., N=4. **P<0.01 compared with CTRL, one-way ANOVA with Dunnett's post hoc test. (e) Migration of N134 tumour cells was determined using in vitro transwell migration chamber. Data are expressed as the normalized number of migrated cells in the bottom chambers in eight fields under × 20 magnification after 72 h relative to that of cells infected with RCASBP-HA-β-actin (CTRL) from three independent experiments. Values are means±s.e.m., N=3. *P<0.05, **P<0.01 compared with CTRL, one-way ANOVA with Dunnett's post hoc test. (f) Western blot analysis for E-cadherin and α-tubulin (as a loading control). E-cadherin was reduced in N134 tumour cells infected with RCASBP-HA-Bcl-xL, mt2 and mt1 compared with cells infected with RCASBP-HA-β-actin. Data shown are representative of six independent experiments. (g) Densitometric values were normalized to tubulin and are expressed relative to the CTRL from six blots. *P< 0.05 compared with CTRL, one-way ANOVA with Dunnett's post hoc test. (h,i) Quantitative real-time PCR analysis of E-cadherin and Sip1 mRNA in N134 tumour cells. *P<0.05, **P<0.01. N=4 independent experiments, and error bar represents s.e.m. Data was analysed using ANOVA, followed by Dunnett's post hoc test.
Figure 5
Figure 5. Bcl-xL mutants defective in anti-apoptotic function enhance metastasis of BON1-TGL cells in vivo.
(a) The expression of HA-Bcl-xL, mt2 or mt1 in BON1-TGL infected with the retroviruses of pQCXIP vector bearing each construct was confirmed with western blot analysis for HA and α-tubulin (as a loading control). (b) Representative bioluminescent images of NSG mice (upper panel) and their pancreases and livers (lower panel). Intracardiac injections of BON1-TGL cells overexpressing mt2 and mt1 developed highly aggressive metastasis throughout the body. A total of 1 × 10⁶ cells were injected into the left ventricle of five recipient NSG mice for each group. The location of BON1-TGL cells was monitored by in vivo bioluminescent imaging 4 weeks after injection. Bioluminescent signal was detected in several organs including the pancreas and liver right after the mice were killed. (c) Immunohistochemical staining of HA in the liver sections from NSG mice injected with BON1-TGL overexpressing mt2 and mt1. Lower panel shows high magnification of immunostained liver sections. Note the nuclear staining of HA-mt1 (arrows) in the inserted photo. Scale bar, 500 μm for upper panel and 50 μm for lower panel. Original magnification × 40 for inserted photos. (d) Representative metastases found in the multiple organs of mice injected with BON1-TGL cells overexpressing mt1. Immunohistochemical staining of luciferase on the sections of pancreas, kidney, lung and salivary gland was shown. Scale bar, 50 μm. Original magnification, × 40.
Figure 6
Figure 6. Bcl-xL overexpression in BON1-TGL cells increases TGFβ levels in a Bax/Bak-independent manner.
(a) Western blot analysis for H3K4me3 and total H3 (as a loading control). H3K4me3 was increased in BON1-TGL cells overexpressing HA-Bcl-xL, mt2 and mt1 compared with vector alone. Bar graph showing densitometric values normalized to H3 and expressed relative to the control from three blots. *P<0.05 compared with the control, one-way ANOVA with Holm's post hoc test. (b) Real-time quantitative PCR analysis of immunoprecipitates from ChIP using anti-H3K4me3 antibodies or normal rabbit serum for enrichment of TGFβ promoter. Data were calculated as fold enrichment over the input control with error bars (means±s.e.m.) from three independent experiments. *P<0.05, compared with control, one-way ANOVA with Tukey's post hoc test. (c) TGFβ mRNA was increased in BON1-TGL cells overexpressing HA-Bcl-xL, mt2 and mt1 compared with BON1-TGL cells overexpressing vector alone from three independent experiments. Values are means±s.e.m., N=3. *P<0.05, **P<0.01 compared with vector alone, one-way ANOVA with Dunnett's post hoc test. (d) Western blot shows TGFβ precursor and mature TGFβ in cell lysates and media from BON1-TGL cells overexpressing HA-Bcl-xL, mt2 or mt1 compared with BON1-TGL cells overexpressing vector alone. Mature TGFβ was strongly detected in culture medium from BON1-TGL cells with HA-Bcl-xL, mt2 and mt1. This blot is representative of three independent experiments. Blots were stained with Ponceau S to ensure equal protein loading and transfer. Data shown are representative of three independent experiments. (e) Invasion of BON1-TGL cells overexpressing HA-Bcl-xL was determined using in vitro matrigel-coated transwell invasion chamber. Cells were pretreated with α-TGFβ (2 μg ml−1) or Actinomycin D (0.01 μg ml−1) for 2 h and 2 × 10⁴ cells were plated in the upper chambers of transwell inserts in the presence of the respective drugs. Data are expressed as the normalized number of cells migrated to the bottom surface of the transwell inserts in eight fields under × 20 magnification after 24 h relative to that of cells with vector alone. Values are means±s.e.m., N=3. *P<0.05, compared with vehicle-treated HA-Bcl-xL, one-way ANOVA with Holm's post hoc test. Scale bar, 100 μm.
Figure 7
Figure 7. Subcellular localizations of HA-Bcl-xL proteins.
(a,b) wt MEFs (a) or BON1-TGL (b) cells with HA-Bcl-xL, mt2 or mt1 were cultured on glass coverslips, immunostained with HA and DAPI to identify the nuclei and analysed with confocal microscopy. Bcl-xL was found in multiple subcellular locations. Note the nuclear staining of cells with mt1. Photographs show representative staining from three independent experiments. Scale bar, 10 μm. Original magnification, × 60. The graph shows the ratio of nuclear to cytoplasmic HA fluorescence (background-subtracted) with the s.d. The mean intensities of nuclear HA staining by selecting a region in the nucleus and cytoplasmic HA by subtracting a nuclear region from each cell was determined using Metamorph. This was performed from at least seven pictures taken using confocal microscope. Data were analysed using ANOVA, followed by Tukey's post hoc test. ** indicates values significantly different from HA-Bcl-xL at P<0.01. (c) N134 cells infected with RCASBP-HA-β-actin, HA-Bcl-xL, mt2 or mt1 were cultured on glass coverslips, immunostained with HA (green) and DAPI (blue) to identify the nuclei and analysed using confocal microscopy. Bcl-xL was found in multiple subcellular locations. Scale bar, 10 μm. Original magnification, × 60. The graph shows the ratio of nuclear to cytoplasmic HA fluorescence (background-subtracted) with the s.d. The mean intensities of nuclear HA staining by selecting a region in the nucleus and cytoplasmic HA by subtracting nuclear region from each cell was determined using Metamorph. This was performed from at least seven pictures taken using confocal microscope. Data were analysed using ANOVA, followed by Tukey's post hoc test. * indicates values significantly different from β-actin at P<0.05. ** indicates values significantly different from β-actin at P<0.01. (d) N134 cells infected with RCASBP-HA-Bcl-xL were subjected to the biochemical fractionation. Bcl-xL was found in both cytosolic and chromatin/nuclear matrix-enriched fraction. P3, chromatin/nuclear matrix-enriched fraction; S2, cytosolic fraction; S3, soluble nuclear proteins, WCL, whole-cell lysate. Calreticulin, also known as endoplasmic reticulum-resident protein 60, and histone 3 were used as controls for the biochemical fractionation.
Figure 8
Figure 8. Nuclear Bcl-xL facilitates tumour cell migration and EMT activation.
(a) Schematic diagram of Bcl-xL wild-type and fusion constructs. Amino-acid sequence for ActA is ILAMLAIGVFSLGAFIKIIQLRKNN, for 3x NLS is 3x (DPKKKRKV) and for NES is LQLPPLERLTLD. BH, Bcl-2 homology domain; TM, transmembrane domain. (b) Confocal images of subcellular localization of HA-Bcl-xL in N134 cells following incubation with red-fluorescent Mito Tracker and HA (green) and DAPI (blue) staining. Scale bar, 10 μm. (c) Mitochondrial Bcl-xL, not nuclear Bcl-xL, prevents apoptosis. N134 cells were treated with 10-μM etoposide for 24 h and then apoptosis was examined using flow cytometry analysis following Annexin V and PI staining. Data are expressed as the per cent of Annexin V-positive cells relative to that of vehicle-treated cells from three independent experiments (mean±s.e.m., n=3). *P<0.01 compared with vehicle-treated CTLR, and #P<0.01 compared with etoposide-treated CTRL, one-way ANOVA with Dunnett's post hoc analysis. (d) Bright-field images of N134 cells. Cells infected with HA-Bcl-xL or 3x NLS changed morphology compared with CTRL cells (HA-β-actin) and cells expressing ActA or NES. Scale bar, 50 μm. (e) Quantification of the proportion of elongated cells shown in d. Values are means±s.e.m., N=4. **P< 0.01 compared with CTRL, one-way ANOVA with Dunnett's post hoc test. (f) Migration of N134 cells was determined using in vitro transwell migration assay, as previously described. Data are expressed as the normalized number of migrated cells relative to that of CTRL cells. Values are mean±s.e.m., N=4 independent experiments, *P<0.05 compared with CTRL, ANOVA with Dunnett's post hoc test. (g,h) Quantitative real-time PCR analysis of E-cadherin (g), vimentin, zeb1 and sip1 (h) mRNAs in N134 tumour cells infected with RCASBP-HA-β-actin, RCASBP-HA-Bcl-xL, HA-Bcl-xL-ActA, HA-Bcl-xL-3x NLS and HA-Bcl-xL-NES. Values are mean±s.e.m., N=3 independent experiments, *P< 0.05, **P<0.01 compared with CTRL, ANOVA with Dunnett's post hoc test. (i) Model depicting the roles of Bcl-xL in healthy, apoptotic and cancer cells.
Figure 9
Figure 9. Overexpression and the multiple subcellular localization of Bcl-xL in human panNET.
Confocal microscopy images of normal islet (a), primary panNET (b) and liver metastases of panNET (c) stained with Bcl-xL (red), mitochondrial marker MTCO1 (green) and DAPI (blue). Scale bar, 10 μm. Original magnification, × 60.

References

    1. Hanahan D. & Weinberg R. A. Hallmarks of cancer: the next generation. Cell 144, 646–674 (2011). - PubMed
    1. Reed J. C. Dysregulation of apoptosis in cancer. J. Clin. Oncol. 17, 2941–2953 (1999). - PubMed
    1. Yin X. M., Oltvai Z. N. & Korsmeyer S. J. BH1 and BH2 domains of Bcl-2 are required for inhibition of apoptosis and heterodimerization with Bax. Nature 369, 321–323 (1994). - PubMed
    1. Placzek W. J. et al.. A survey of the anti-apoptotic Bcl-2 subfamily expression in cancer types provides a platform to predict the efficacy of Bcl-2 antagonists in cancer therapy. Cell Death Dis. 1, e40 (2010). - PMC - PubMed
    1. Davids M. S. & Letai A. Targeting the B-cell lymphoma/leukemia 2 family in cancer. J. Clin. Oncol. 30, 3127–3135 (2012). - PMC - PubMed

Publication types

MeSH terms