Review
. 2016;23(7):667-85.
doi: 10.2174/0929867323666160119094516.

Role of Tyrosine Isomers in Acute and Chronic Diseases Leading to Oxidative Stress - A Review

Affiliations
Review

Role of Tyrosine Isomers in Acute and Chronic Diseases Leading to Oxidative Stress - A Review

Gergő A Molnár et al. Curr Med Chem. 2016.

Abstract

Oxidative stress plays a major role in the pathogenesis of a variety of acute and chronic diseases. Measurement of the oxidative stress-related end products may be performed, e.g. that of structural isomers of the physiological para-tyrosine, namely meta- and ortho-tyrosine, that are oxidized derivatives of phenylalanine. Recent data suggest that in sepsis, serum level of meta-tyrosine increases, which peaks on the 2(nd) and 3(rd) days (p<0.05 vs. controls), and the kinetics follows the intensity of the systemic inflammation correlating with serum procalcitonin levels. In a similar study subset, urinary meta-tyrosine excretion correlated with both need of daily insulin dose and the insulin-glucose product in non-diabetic septic cases (p<0.01 for both). Using linear regression model, meta-tyrosine excretion, urinary meta-tyrosine/para-tyrosine, urinary ortho-tyrosine/para-tyrosine and urinary (meta- + orthotyrosine)/ para-tyrosine proved to be markers of carbohydrate homeostasis. In a chronic rodent model, we tried to compensate the abnormal tyrosine isomers using para-tyrosine, the physiological amino acid. Rats were fed a standard high cholesterol-diet, and were given para-tyrosine or vehicle orally. High-cholesterol feeding lead to a significant increase in aortic wall meta-tyrosine content and a decreased vasorelaxation of the aorta to insulin and the glucagon-like peptide-1 analogue, liraglutide, that both could be prevented by administration of para-tyrosine. Concluding, these data suggest that meta- and ortho-tyrosine are potential markers of oxidative stress in acute diseases related to oxidative stress, and may also interfere with insulin action in septic humans. Competition of meta- and ortho-tyrosine by supplementation of para-tyrosine may exert a protective role in oxidative stress-related diseases.


Figures

Fig. (1)
Fig. (1)
Conversion reactions of phenylalanine yielding para-, meta- and ortho-tyrosine, and formation of isoforms of dihydroxy-phenylalanine (DOPA) from the different tyrosine isoforms.
Fig. (2)
Fig. (2)
Proposed synthetic routes of meta-tyrosine in plants as suggested by Huang et al. [36].
Fig. (3)
Fig. (3)
Typical chromatograms of the selected biomarkers extracted from the analysis of spiked urine sample. Note: Spiking concentrations were 73 nmol/L for 8OHdG and m-Tyr, 182 nmol/L for 2-dG, o-Tyr, 3NO2-Tyr and 3Cl-Tyr and 23 mM for p-Tyr and Phe. Image from Kuligowski et al. PloS One 2014, 9: e93703 [48], reproduced under the creative commons license.
Fig. (4)
Fig. (4)
Non-zero concentrations found from the analysis of 222 urine samples of extremely low birth-weight infants included in the double-blinded randomized clinical study REOX (REOX 2012-2013, EUDRACT 2088-005047-42). The percentages of concentrations, LOD in the sample set were: 15% for o-Tyr, 79% for m-Tyr, 0% for p-Tyr and Phe, 93% for NO2-Tyr, 68% for 3Cl-Tyr, 0.4% for 8OH-dG and 0.4% for 2dG. Boxes indicate the 1st and the 3rd quartiles, the median is shown as a black line, whiskers mark the 9th and 91st percentiles, red triangles represent mean concentrations and blue circles are outliers. Image from Kuligowski et al. PloS One 2014, 9: e93703 [48], reproduced under the creative commons license.
Fig. (5)
Fig. (5)
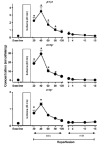
Time course of myocardial release of D stereoisomer of p-, m- and o-Tyr in the cardiac effluent at baseline and at various time points during reperfusion after 30-min ischemia. Hearts were perfused with D-Phe. Data are mean + S.E.; n =8; *p <0.05 vs. pre-ischemic value. Fig. reproduced from Biondi et al. Cardiovasc. Res. 2006, 15;71(2):322-330 [50] with permission of Oxford University Press.
Fig. (6)
Fig. (6)
Serum levels of (A) meta-tyrosine, (B) ortho-tyrosine and (C) para-tyrosine in septic patients. Data are expressed as median and inter-quartile range (IQR; standard 25th-75th percentile) and 5th and 95th confidence interval). Asterisks indicate statistical differences within the septic group compared to day 1 (*: p<0.05; **: p<0.01). The “#” symbols show significant differences between patients and controls (#: p<0.05; ##: p<0.01). Serum para-tyrosine levels showed a significant day-by-day elevation with trend analysis. (p=0.002) Reproduced with permission of Maney Publishing Ltd. from Szélig et al. Redox Report 2015. Jul. 20 [53].
Fig. (7)
Fig. (7)
Urinary (A) meta-tyrosine/creatinine, (B) ortho-tyrosine/creatinine and (C) para-tyrosine/creatinine ratio in septic patients. Data are expressed as median, inter-quartile range (IQR; standard 25th-75th percentile) and 5th and 95th confidence interval. Asterisks indicate statistical differences within the septic group compared to day 1. (*: p<0.05; **: p<0.01; ***: p<0.001). The “#” symbols show significant differences between patients and controls (#: p<0.05; ##: p<0.01; ###: p<0.001). Urinary meta-tyrosine/creatinine ratios had a decreasing tendency (p=0.018), while urinary para-tyrosine/creatinine ratios showed a marked increase (p=0.001). Reproduced with permission of Maney Publishing Ltd. from Szélig et al. Redox Report 2015. Jul. 20 [53].
Fig. (8)
Fig. (8)
Fe of para-, meta- and ortho-tyrosine (median; standard 25th-75th percentile and 5th and 95th confidence interval). Fe of m-Tyr showed a decreasing tendency (p=0.009). (A) Fe of para-tyrosine (median; standard 25th-75th percentile and 5th and 95th confidence interval). (B) Asterisk indicates a statistically relevant difference within the septic group compared to day 1 (*: p<0.05). The “#” symbols show significant differences between cases and controls (#: p<0.05; ##: p<0.01; ###: p<0.001). The “+” symbols show significant differences between Fe of meta- or ortho-tyrosine and that of para-tyrosine (+: p<0.05; ++: p<0.01; +++: p<0.001) Reproduced with permission of Maney Publishing Ltd. from Szélig et al. Redox Report 2015. Jul. 20 [53].
Fig. (9)
Fig. (9)
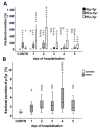
Urinary m-Tyr/p-Tyr ratio in septic patients requiring insulin administration, according to (A) daily insulin dose or (B) insulin-glucose product. #: p=0.005 vs. DID < median; ##: p=0.01 vs. IGP < median. Abbreviations: DID, daily insulin dose; IGP, insulin-glucose product. Reproduced with permission of Hindawi Publishing Corporation from Kun et al. Oxidative Medicine and Cellular Longevity, Article ID 839748 [54].
Fig. (10)
Fig. (10)
Correlation of urinary m-Tyr concentration with (A) DID and (C) IGP. Correlation of urinary m-Tyr/p-Tyr ratio with (B) DID and (D) IGP in septic patients requiring insulin administration. Abbreviations: DID, daily insulin dose; IGP, insulin-glucose product. Reproduced with permission of Hindawi Publishing Corporation from Kun et al. Oxidative Medicine and Cellular Longevity, Article ID 839748 [54].
Fig. (11)
Fig. (11)
Area-under-the-curve (AUC) of plasma insulin during OGTT in control rats (Control), cholesterol-fed rats without p-Tyr supplementation (Chol) and cholesterol-fed rats with p-Tyr supplementation (Chol+p-Tyr). *: p<0.05 vs. Contr. Reproduced with permission of Bentham Science Publishers from Selley et al. Protein and Peptide Letters 2015; 22(8): 736-742 [84].
Fig. (12)
Fig. (12)
Ratios of protein-bound m-Tyr and p-Tyr in thoracic aorta of control rats (Contr), cholesterol-fed rats without p-Tyr supplementation (Chol) and cholesterol-fed rats with p-Tyr supplementation (Chol+p-Tyr). **: p<0.01 vs. Contr. Reproduced with permission of Bentham Science Publishers from Selley et al. Protein and Peptide Letters 2015; 22(8): 736-742 [84].
Fig. (13)
Fig. (13)
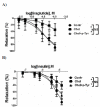
Liraglutide-induced (panel A) and insulin-induced (Panel B) relaxation relaxation of the thoracic aorta of control rats (Contr), cholesterol-fed rats without p-Tyr supplementation (Chol) and cholesterol-fed rats with p-Tyr supplementation (Chol+p-Tyr). *: p<0.05. Reproduced with permission of Bentham Science Publishers from Selley et al. Protein and Peptide Letters 2015; 22(8): 736-742 [84].

References

    1. Halliwell B., Gutteridge J.M. Oxygen toxicity, oxygen radicals, transition metals and disease. Biochem. J. 1984;219:1–14. - PMC - PubMed
    1. Gutteridge J.M. Hydroxyl radicals, iron, oxidative stress, and neurodegeneration. Ann. N. Y. Acad. Sci. 1994;738:201–213. - PubMed
    1. Paravicini T.M., Touyz R.M. NADPH oxidases, reactive oxygen species, and hypertension: clinical implications and therapeutic possibilities. Diabetes Care. 2008;31(Suppl. 2):S170–S180. - PubMed
    1. van der Vliet A., Janssen-Heininger Y.M. Hydrogen peroxide as a damage signal in tissue injury and inflammation: murderer, mediator, or messenger? J. Cell. Biochem. 2014;115(3):427–435. - PMC - PubMed
    1. Mittal M., Siddiqui M.R., Tran K., Reddy S.P., Malik A.B. Reactive oxygen species in inflammation and tissue injury. Antioxid. Redox Signal. 2014;20(7):1126–1167. - PMC - PubMed