. 2016 Mar 25;291(13):6858-71.
doi: 10.1074/jbc.M115.694729. Epub 2016 Jan 19.

Structural Determinants of Oligomerization of the Aquaporin-4 Channel

Affiliations

Structural Determinants of Oligomerization of the Aquaporin-4 Channel

Philip Kitchen et al. J Biol Chem. .

Abstract

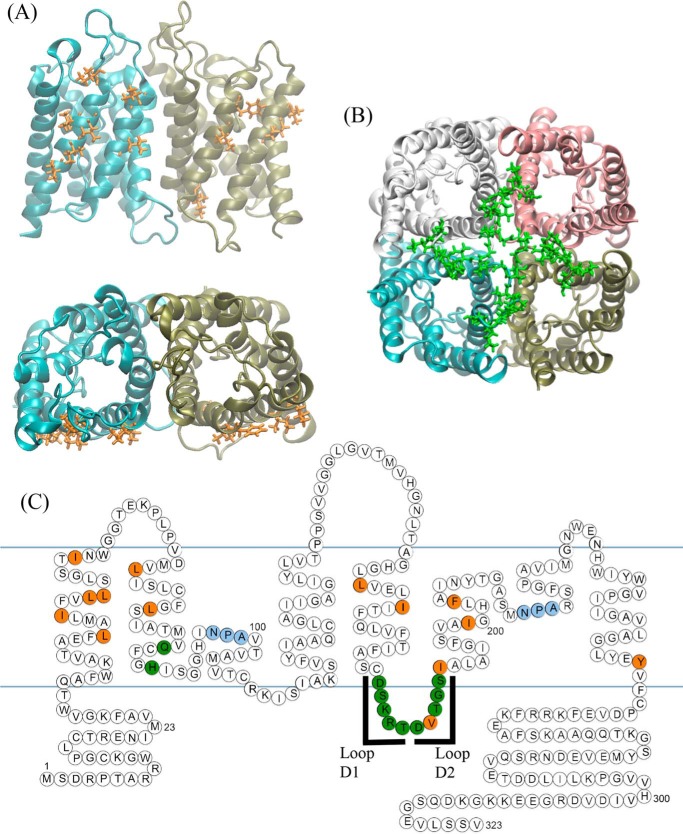
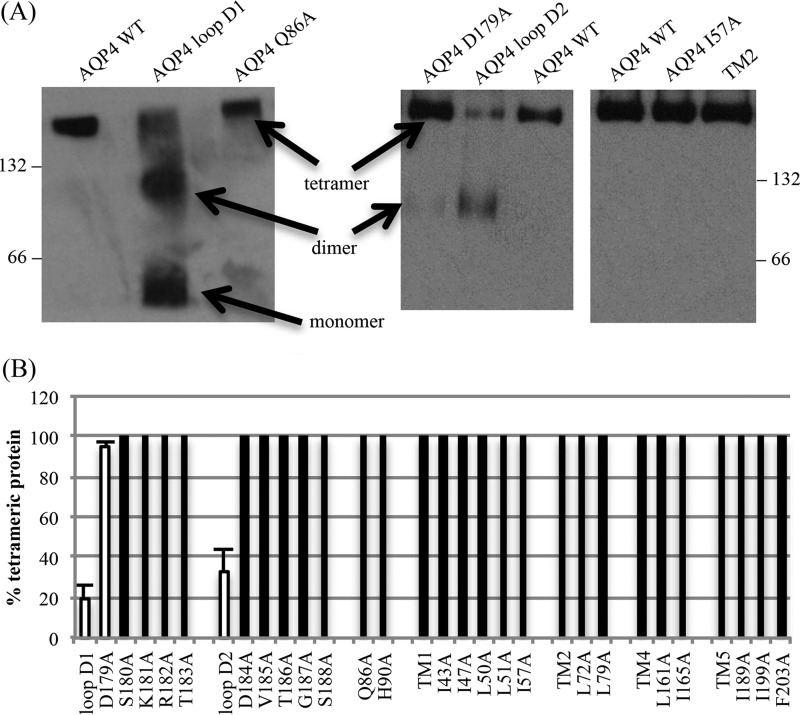
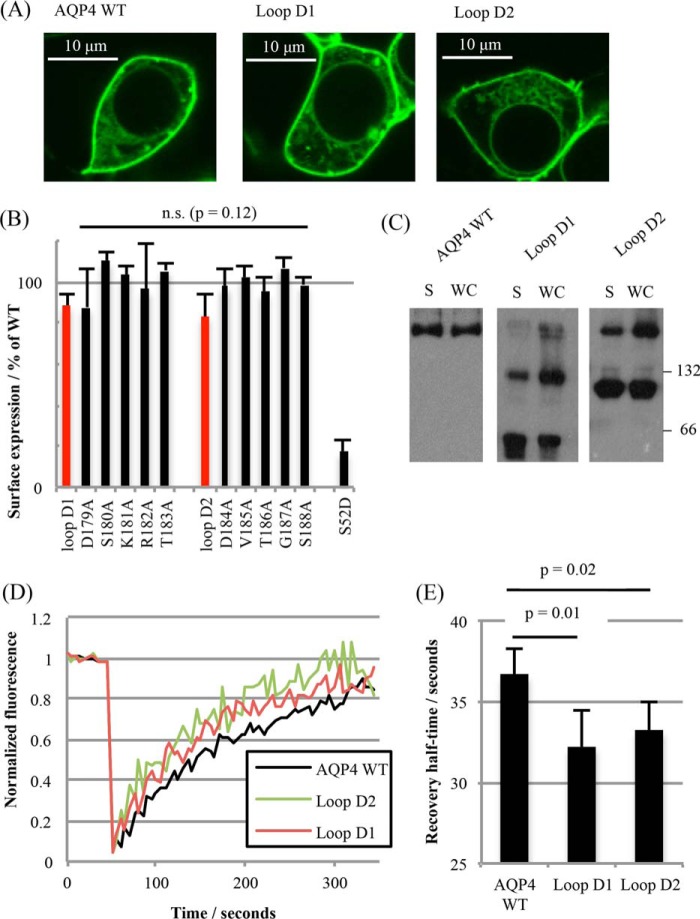
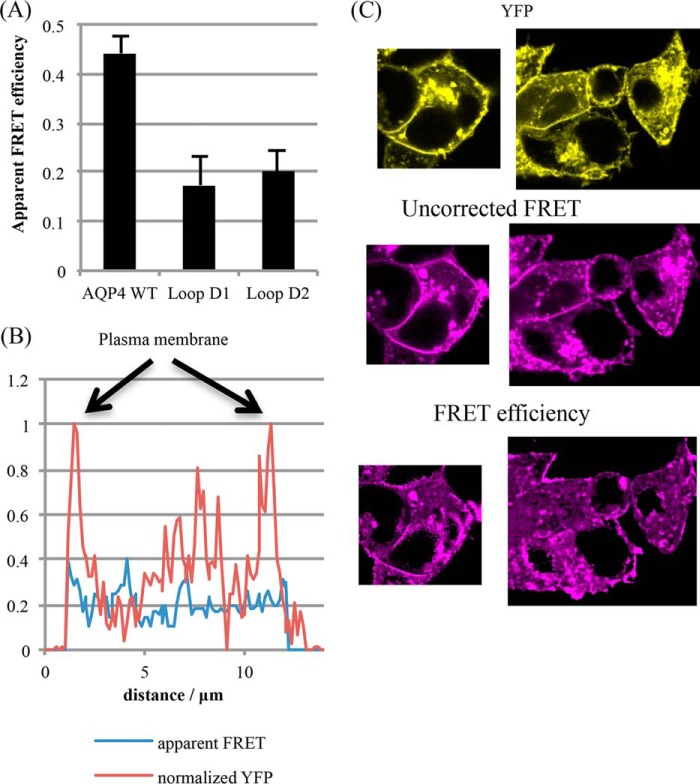
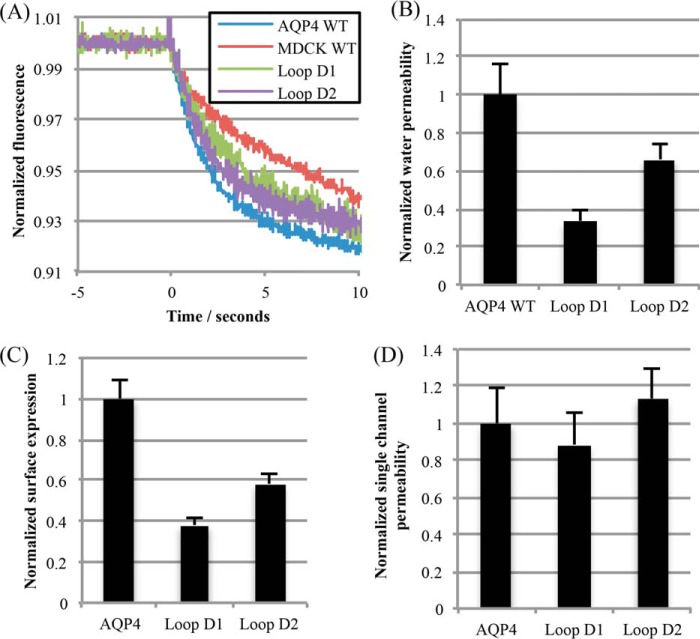
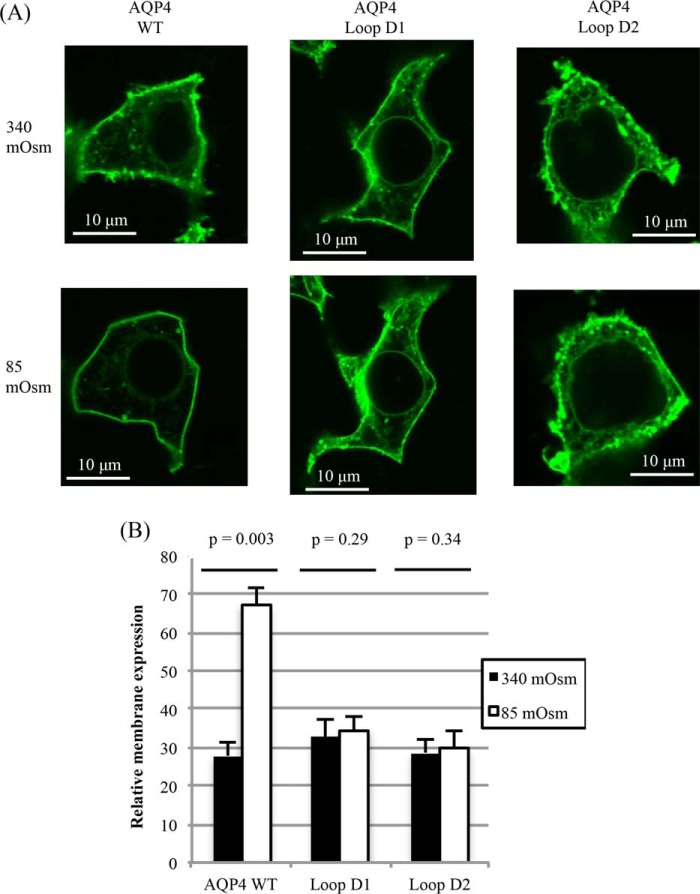
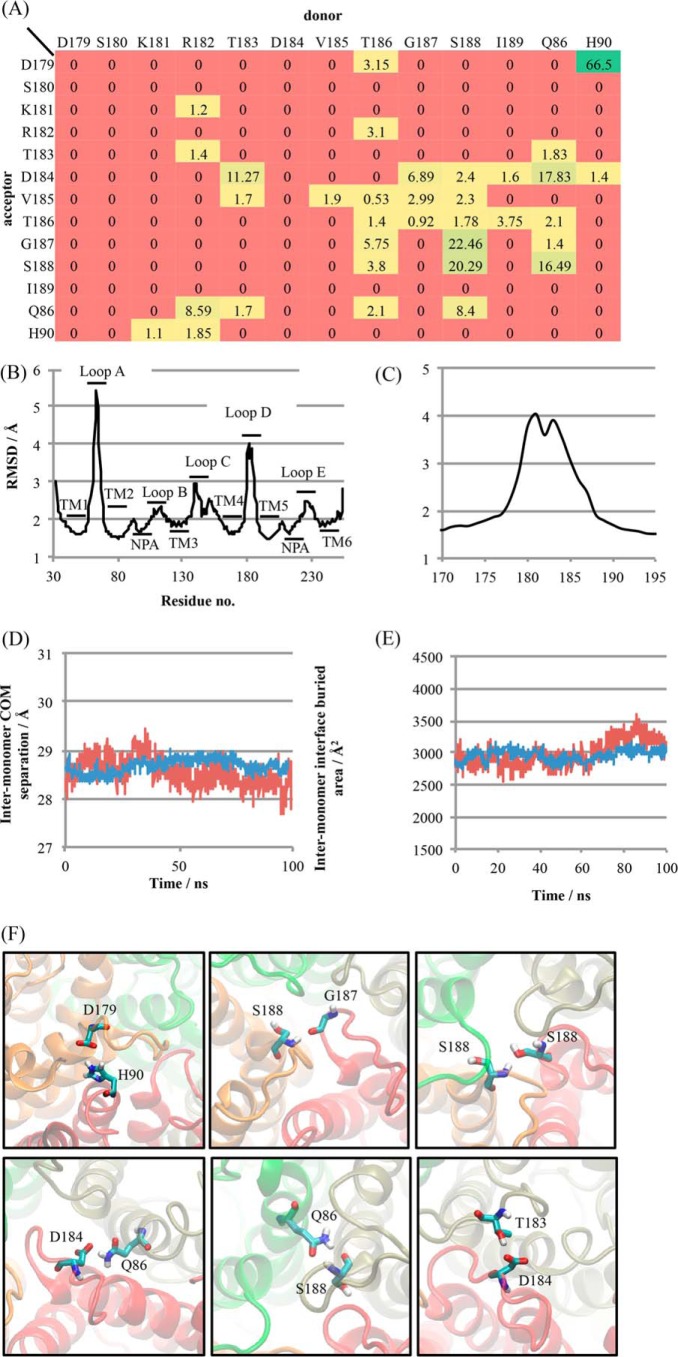
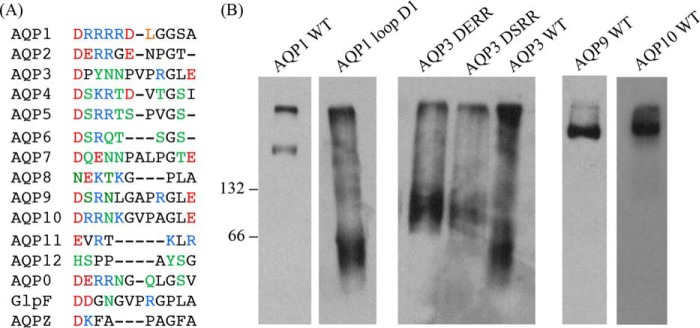
The aquaporin (AQP) family of integral membrane protein channels mediate cellular water and solute flow. Although qualitative and quantitative differences in channel permeability, selectivity, subcellular localization, and trafficking responses have been observed for different members of the AQP family, the signature homotetrameric quaternary structure is conserved. Using a variety of biophysical techniques, we show that mutations to an intracellular loop (loop D) of human AQP4 reduce oligomerization. Non-tetrameric AQP4 mutants are unable to relocalize to the plasma membrane in response to changes in extracellular tonicity, despite equivalent constitutive surface expression levels and water permeability to wild-type AQP4. A network of AQP4 loop D hydrogen bonding interactions, identified using molecular dynamics simulations and based on a comparative mutagenic analysis of AQPs 1, 3, and 4, suggest that loop D interactions may provide a general structural framework for tetrameric assembly within the AQP family.

Keywords: aquaporin; cellular regulation; oligomerization; protein translocation; water channel.


Figures

FIGURE 1.
FIGURE 1.
Residues at the AQP4 tetrameric interface. A, we identified hydrophobic residues (orange) in TMs 1, 2, 4, and 5 that formed inter-monomer contacts in the crystal structure and B, polar residues (green) at the bottom of TM2 and in the intracellular loop D. C, ball diagram showing the position of the identified residues in the primary sequences and secondary structural motifs of AQP4. Two regions of loop D were selected for compound mutation, which we denote loop D1 (179DSKRT183) and loop D2 (184DVTGS188). Blue lines represent the approximate position of membrane lipid headgroups. All residues are listed in Table 1.
FIGURE 2.
FIGURE 2.
BN-PAGE and Western blotting of AQP4 mutants. A, representative Western blots following BN-PAGE of Triton X-100-solubilized AQP4 mutants, showing the effect of the loop D1 and loop D2 compound mutations, and a lack of effect of mutations on the transmembrane hydrophobic patch. 66 and 132 denote the positions of BSA molecular weight marker bands. The AQP4-GFP construct, including linker peptide, has a predicted molecular mass of 63.1 kDa. B, percentage of protein assembled into tetramers calculated using densitometry following BN-PAGE and Western blotting. Effective mutations are highlighted with white bars. Data are presented as mean ± S.E. from 3 experimental repeats.
FIGURE 3.
FIGURE 3.
Plasma membrane localization of non-tetrameric mutants. A, representative fluorescence micrographs of HEK293 cells transfected with C-terminal GFP fusions of AQP4 WT and loop D mutants. B, surface expression of AQP4 mutants in HEK293 cells measured by cell surface biotinylation followed by a neutravidin-based ELISA. Loop D compound mutants are highlighted in red. The S52D mutant was used as a negative control for surface expression. n.s., not significant. C, reprsentative blots of AQP4 mutants subjected to BN-PAGE. WC, whole cell lysate; S, surface protein only, isolated by cell surface biotinylation. D, representative FRAP curves from photobleaching AQP4-GFP fusion proteins in HEK293 cells. E, average half-times of fluorescence recovery averaged over fits to 5 curves per experiment and 6 experimental repeats. All data are presented as mean ± S.E.
FIGURE 4.
FIGURE 4.
A FRET biosensor for AQP4 oligomerization. A, fluorescence confocal microscopy of live HEK293 cells transiently transfected with AQP4-Venus alone, AQP4-mTurquoise2 alone, and the two co-transfected. Excitation (Ex) at 405 nm is for Turquoise and 514 is for Venus. The contrast of these images has been manually optimized to aid the eye. All analysis was performed on raw, unadjusted images. Em, emission.
FIGURE 5.
FIGURE 5.
Reduced FRET from AQP4 mutants. A, average apparent FRET efficiencies for AQP4 wild-type and loop D1 and D2 mutants, calculated by normalizing the corrected FRET intensity to YFP intensity for each pixel. Five different areas on each plate were imaged per experimental repeat, n = 4. B, representative line scan across a cell, passing through membrane and cytoplasm and avoiding the nucleus. Whereas the YFP signal (red) shows clear peaks at the plasma membrane, the FRET efficiency (blue) does not. C, representative processed FRET efficiency images compared with unprocessed FRET and YFP. Whereas both YFP and the raw FRET show clear membrane signals, the FRET efficiency does not.
FIGURE 6.
FIGURE 6.
Water permeability of non-tetrameric mutants. A, representative calcein fluorescence quenching curves from stably transfected MDCK cells subjected to a 200 mosmol of mannitol osmotic gradient. B, water permeability of MDCK cells normalized to AQP4 WT-transfected MDCK cells. C, normalized surface expression of AQP4 constructs in the stably expressing MDCK clones used for water permeability measurements, measured by cell surface biotinylation. D, MDCK membrane water permeability normalized to surface expression, to give normalized single channel permeability. All data are presented as mean ± S.E., n = 4.
FIGURE 7.
FIGURE 7.
Tonicity-induced translocation of non-tetrameric mutants. A, representative fluorescence micrographs of HEK293 cells transfected with AQP4-GFP fusion proteins, before and after 30 s of exposure to hypotonic (85 mosmol) medium. B, relative membrane expression of AQP4-GFP fusion proteins before and after exposure to hypotonic medium. At least 4 cells per image were analyzed for each experimental repeat, n = 3. Data are presented as mean ± S.E.
FIGURE 8.
FIGURE 8.
A dynamic network of loop D hydrogen bonds in simulations of AQP4. A, heat map showing percentage occupancy of loop D hydrogen bonds averaged over 4 monomers comprising a tetramer and over 5 independent 100-ns simulations. B, backbone heavy atom root mean square deviation (RMSD) of AQP4 residues, demonstrating the structural flexibility of loops A and D. RMSDs were calculated independently for each trajectory and averaged. C, close-up view of loop D RMSD. D, representative inter-monomer center of mass distance for a single interface (red) and averaged over the four interfaces of a tetramer (blue). E, representative inter-monomer buried area for a single interface (red) and averaged over the four interfaces of a tetramer (blue). F, snapshots of molecular dynamics trajectories in which the six most highly occupied inter-monomer hydrogen bonds involving loop D residues are occupied.
FIGURE 9.
FIGURE 9.
Comparison of loop D between different human AQPs. A, all 13 human AQPs as well as AQPZ and GlpF (both from E. coli) were aligned using Clustal Omega (EMBL-EBI). Acidic residues are colored red; basic, blue; and neutral residues able to form sidechain hydrogen bonds, green. B, BN-PAGE and Western blotting of wild-type and mutant AQPs 1 and 3 and wild-type AQPs 9 and 10. 66 and 132 represent BSA molecular weight markers.

References

    1. Jung J. S., Preston G. M., Smith B. L., Guggino W. B., and Agre P. (1994) Molecular structure of the water channel through aquaporin CHIP: the hourglass model. J. Biol. Chem. 269, 14648–14654 - PubMed
    1. Hub J. S., Grubmuller H., and de Groot B. L. (2009) Dynamics and energetics of permeation through aquaporins: what do we learn from molecular dynamics simulations? Handb. Exp. Pharmacol. 2009, 57–76 - PubMed
    1. Horner A., Zocher F., Preiner J., Ollinger N., Siligan C., Akimov S. A., and Pohl P. (2015) The mobility of single-file water molecules is governed by the number of H-bonds they may form with channel-lining residues. Sci. Adv. 1, e1400083. - PMC - PubMed
    1. Chevalier A. S., and Chaumont F. (2015) Trafficking of plant plasma membrane aquaporins: multiple regulation levels and complex sorting signals. Plant Cell Physiol. 56, 819–829 - PMC - PubMed
    1. Kaldenhoff R., Kai L., and Uehlein N. (2014) Aquaporins and membrane diffusion of CO2 in living organisms. Biochim. Biophys. Acta 1840, 1592–1595 - PubMed

Publication types

MeSH terms

Associated data

LinkOut - more resources