. 2016 Mar 18;291(12):6316-30.
doi: 10.1074/jbc.M116.713842. Epub 2016 Jan 19.

Epigenetic Regulation of the Blimp-1 Gene (Prdm1) in B Cells Involves Bach2 and Histone Deacetylase 3

Affiliations

Epigenetic Regulation of the Blimp-1 Gene (Prdm1) in B Cells Involves Bach2 and Histone Deacetylase 3

Hiromu Tanaka et al. J Biol Chem. .

Abstract

B lymphocyte-induced maturation protein 1 (Blimp-1) encoded by Prdm1 is a master regulator of plasma cell differentiation. The transcription factor Bach2 represses Blimp-1 expression in B cells to stall terminal differentiation, by which it supports reactions such as class switch recombination of the antibody genes. We found that histones H3 and H4 around the Prdm1 intron 5 Maf recognition element were acetylated at higher levels in X63/0 plasma cells expressing Blimp-1 than in BAL17 mature B cells lacking its expression. Conversely, methylation of H3-K9 was lower in X63/0 cells than BAL17 cells. Purification of the Bach2 complex in BAL17 cells revealed its interaction with histone deacetylase 3 (HDAC3), nuclear co-repressors NCoR1 and NCoR2, transducin β-like 1X-linked (Tbl1x), and RAP1-interacting factor homolog (Rif1). Chromatin immunoprecipitation confirmed the binding of HDAC3 and Rif1 to the Prdm1 locus. Reduction of HDAC3 or NCoR1 expression by RNA interference in B cells resulted in an increased Prdm1 mRNA expression. Bach2 is suggested to cooperate with HDAC3-containing co-repressor complexes in B cells to regulate the stage-specific expression of Prdm1 by writing epigenetic modifications at the Prdm1 locus.

Keywords: B cells; acetylation; epigenetics; gene regulation; histone; methylation; plasma cells; transcription factor.


Figures

FIGURE 1.
FIGURE 1.
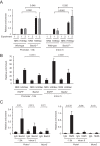
Histone acetylation at the Prdm1 promoter and intron 5 MARE regions in BAL17 and X63/0 cells. A, schematic representation of mouse Prdm1 is shown. The small lines denote MARE. B and C, ChIP assays of BAL17 (mature B cell) and X63/0 (plasma cell) using antibodies against acetylated histone H3 (Lys-9 and Lys-14) (B) or acetylated histone H4 (Lys-5, Lys-8, Lys-12, and/or Lys-16) (C) at the Prdm1 promoter 1,800 MARE (left panel) and intron 5 MARE (right panel). D–F, ChIP assays of BAL17 and X63/0 cells with antibodies against indicated acetylated residues of H3K9ac (D), K18ac (E), and K27ac (F). The relative levels of enrichment in B–F are shown as mean values of two independent experiments and standard error of the mean with p values (Student's t test) for differences between BAL17 and X63/0 cells. NRS, normal rabbit serum.
FIGURE 2.
FIGURE 2.
Histone methylation at the Prdm1 promoter and intron 5 MARE regions in BAL17 and X63/0 cells. A–C, ChIP assays of mono-, di-, and tri-methylation of histone H3-K4 as in Fig. 1. D and E, ChIP assays of di- and tri-methylation of histone H3-K9. The relative levels of enrichment are shown as mean values of three experiments and standard error of the mean with p values (Student's t test) for differences between BAL17 and X63/0 cells. NRS, normal rabbit serum.
FIGURE 3.
FIGURE 3.
Bach2 is required to maintain Prdm1 H3-K9 acetylation at a lower level in B cells. A, ChIP assays of histone H3K9ac. Splenic B cells from wild-type or Bach2−/− mice were compared as in Fig. 1. The results from two independent ChIP assays evaluated by qPCR in triplicates are shown as mean values and standard error of the mean with p values (Student's t test) for differences between wild-type and Bach2−/− B cells. NRS, normal rabbit serum. B, 2 days after infection of Bach2−/− B cells with control enhanced GFP or Bach2 retroviruses, the levels of histone H3K9ac were compared with ChIP assays. The relative levels of enrichment are shown as mean values of two independent experiments and standard error of the mean with p values (Student's t test) for differences between enhanced GFP-expressing and Bach2-expressing Bach2−/− B cells. C, ChIP assays of endogenous Bach2 and MafK using primary wild-type splenic B cells. The promoter region of the Mcm5 gene was also compared. The relative levels of enrichment from three independent ChIP assays are shown as mean values and standard error of the mean with p values (Student's t test) for differences between anti-Bach2 (left panel) or anti-MafK (right panel) antiserum and control IgG.
FIGURE 4.
FIGURE 4.
Purification of Bach2 complex in BAL17 mature B cells. A, expression of FLAG-HA epitope-tagged Bach2 (eBach2). Immunoblotting analysis was carried out with anti-Bach2 antiserum using nuclear extracts from non-transduced (Mock) and eBach2-expressing BAL17 cells. IB, immunoblot. B, Bach2 complex was purified from nuclear extracts prepared from eBach2-expressing BAL17 cells. Mock purification from nuclear extracts prepared from nontransduced BAL17 cells was performed as a control. IP, immunoprecipitation. C–G, identification of Rif1, Tbl1x, HDAC3, MafG, and MafK by mass spectrometry. Amino acid sequences of peptides were determined by a mass spectrometry/mass spectrometry analysis.
FIGURE 5.
FIGURE 5.
Proteins interacting with Bach2. A, schematic representation of candidate proteins interacting with Bach2. The mass spectrometry data from independent purifications were compiled. Proteins were selected based on two criteria, protein score of more than 130 and being absent in the mock samples. The protein score of HDAC3 was lower than 130 in this experiment but is indicated here to give its context. The thickness of each edge represents protein scores. Proteins are colored based on their representative functions as in the color key. B, interaction of Bach2 with known protein complexes. Known interactions are integrated with the results in A.
FIGURE 6.
FIGURE 6.
Bach2-HDAC3-Rif1 interactions. A, immunoblot analysis of the affinity-purified samples (derived from Fig. 4B) using anti-Rif1 anti-Bach2, anti-Tbl1x, or anti-HDAC3 antibodies. B, lysates from BAL17 cells were immunoprecipitated (IP) with anti-Bach2 antiserum (Bach2N-2) or control antibodies (IgG) and analyzed by immunoblotting (IB) using anti-Bach2 or anti-HDAC3 antibodies. Inputs were also analyzed. C, lysates were immunoprecipitated with anti-HDAC3 or control antibodies and analyzed by immunoblotting using anti-Bach2 or anti-HDAC3 antibodies. Inputs were also analyzed. The dots indicate the bands that reacted with the anti-Bach2 antiserum. D, interaction of Rif1 with Bach2. FLAG-Rif1 and Bach2 were overexpressed in 293T cells in the indicated combinations. FLAG-Rif1 was immunoprecipitated with anti-FLAG antibody. The resulting samples were analyzed by immunoblotting using anti-FLAG or anti-Bach2 antibodies. An image of immunoblotting analysis of input samples (1% amount of loading for immunoprecipitation) is also shown to clarify the levels of Bach2 expression. E, interaction of Rif1 with HDAC3. FLAG-Rif1 and HA-HDAC3 were overexpressed in 293T cells in the indicated combinations, and their interaction was analyzed as in D. An image of shorter exposure is also shown for the HDAC3 immunoblotting (bottom) to clarify the levels of HDAC3 expression. IP, immunoprecipitate. IB, immunoblot. The dot and asterisk on the left indicate specific and nonspecific bands, respectively.
FIGURE 7.
FIGURE 7.
Involvement of HDAC3 and NCoR1 in Prdm1 repression. A, HDAC activity is required for Prdm1 repression. BAL17 cells were treated with or without 7.5 μg/ml TSA for 12 h. The mRNA levels of Prdm1 were determined by RT-qPCR. The results are shown as mean values of three independent experiments and standard error of the mean with a p value (Student's t test). B, BAL17 cells were treated with 10 or 50 μm of RGFP966 for 12 h. The mRNA levels of Prdm1 were determined by RT-qPCR. The results are shown as mean values of two independent experiments and standard error of the mean with p values (Student's t test) for differences between RGFP966 and control DMSO treatments. C, expression of HDAC3 and Blimp-1 mRNA in mouse primary B cells expressing RNAi duplex targeting HDAC3. The expression levels of HDAC3 and Blimp-1 mRNA in HDAC3 knockdown LPS-stimulated splenic B cells were evaluated by RT-qPCR. The values represent the means and standard error of the mean with p values (Student's t test) at 36 or 48 h of LPS stimulation. n = 7 (36 h) or 4 (48 h). D, HDAC3 binds to the Prdm1 locus. ChIP assays of BAL17 cells were performed with antibody against HDAC3. The relative levels of enrichment of the indicated genomic DNA regions are shown as mean values of two independent ChIP assays and standard error of the mean with p values (Student's t test) for differences between anti-HDAC3 antibody and normal IgG. E, 12 h after treatment of BAL17 cells with control DMSO or 10 mm RGFP966, the levels of histone H3K27ac at indicated regions of Prdm1 were compared with ChIP assays. The relative levels of enrichment are shown as mean values of two independent experiments and standard error of the mean with p values (Student's t test) for differences between DMSO and RGFP966. F, effect of NCoR1 knockdown upon Prdm1 expression. The expression levels of NCoR1 (left panel) and Blimp-1 (right panel) mRNA were determined by RT-qPCR in BAL17 cells expressing shRNA targeting the NCoR1 mRNA or a control shRNA. The results are shown as mean values of two independent experiments and standard error of the mean with p values (Student's t test).
FIGURE 8.
FIGURE 8.
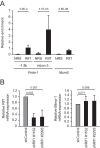
Binding of Rif1 to the Prdm1 locus. A, Rif1 binds to the Prdm1 locus. ChIP assays of BAL17 cells were performed with antibody against Rif1. The relative levels of enrichment of the indicated genomic DNA regions are shown as mean values of two independent ChIP assays and standard error of the mean with p values (Student's t test) for differences between anti-Rif1 antibody and normal rabbit serum (NRS). B, effect of Rif1 knockdown on Prdm1 expression. The expression levels of Rif1 (left panel) and Blimp-1 (right panel) mRNA were determined by RT-qPCR in BAL17 cells expressing shRNA targeting Rif1 mRNA and control shRNA. The results are shown as mean values of two independent experiments and standard error of the mean with p values (Student's t test).
FIGURE 9.
FIGURE 9.
Bach2 interacts with HDAC3 and inhibits Prdm1 expression in primary B cells. A, whole cell extracts from B1-8hi B cells activated in vitro for 12 h were immunoprecipitated with anti-Bach2 antibody. Immunoblot analyses were carried out with the indicated antibodies. The arrowhead indicates NCoR1. The results are representative of two independent experiments. B, expression of indicated genes in B1-8hi B cells with or without knockdown of Bach2 mRNA. The results are shown as mean values of three independent experiments and S.E. with p values. C, plasma cell differentiation of B1-8hi B cells was monitored by the expression of syndecan 1 with or without knockdown of Bach2 mRNA. The data are representative of three independent experiments.

Similar articles

Cited by

References

    1. Igarashi K., Ochiai K., Itoh-Nakadai A., and Muto A. (2014) Orchestration of plasma cell differentiation by Bach2 and its gene regulatory network. Immunol. Rev. 261, 116–125 - PubMed
    1. Shaffer A. L., Lin K. I., Kuo T. C., Yu X., Hurt E. M., Rosenwald A., Giltnane J. M., Yang L., Zhao H., Calame K., and Staudt L. M. (2002) Blimp-1 orchestrates plasma cell differentiation by extinguishing the mature B cell gene expression program. Immunity 17, 51–62 - PubMed
    1. Shapiro-Shelef M., Lin K. I., McHeyzer-Williams L. J., Liao J., McHeyzer-Williams M. G., and Calame K. (2003) Blimp-1 is required for the formation of immunoglobulin secreting plasma cells and pre-plasma memory B cells. Immunity 19, 607–620 - PubMed
    1. Sciammas R., and Davis M. M. (2004) Modular nature of Blimp-1 in the regulation of gene expression during B cell maturation. J. Immunol. 172, 5427–5440 - PubMed
    1. Kallies A., Hasbold J., Tarlinton D. M., Dietrich W., Corcoran L. M., Hodgkin P. D., and Nutt S. L. (2004) Plasma cell ontogeny defined by quantitative changes in blimp-1 expression. J. Exp. Med. 200, 967–977 - PMC - PubMed

Publication types

MeSH terms

LinkOut - more resources