Review
. 2016 Apr 1;109(4):480-92.
doi: 10.1093/cvr/cvw011. Epub 2016 Jan 19.

Presence and stability of rotors in atrial fibrillation: evidence and therapeutic implications

Affiliations
Review

Presence and stability of rotors in atrial fibrillation: evidence and therapeutic implications

María S Guillem et al. Cardiovasc Res. .

Abstract

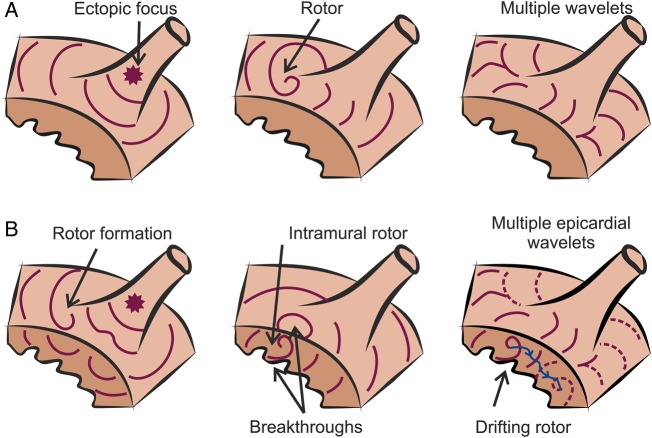
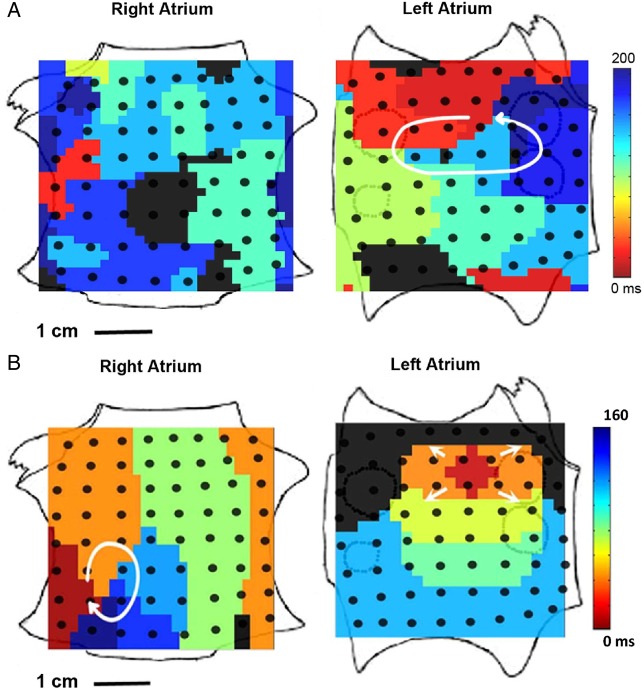
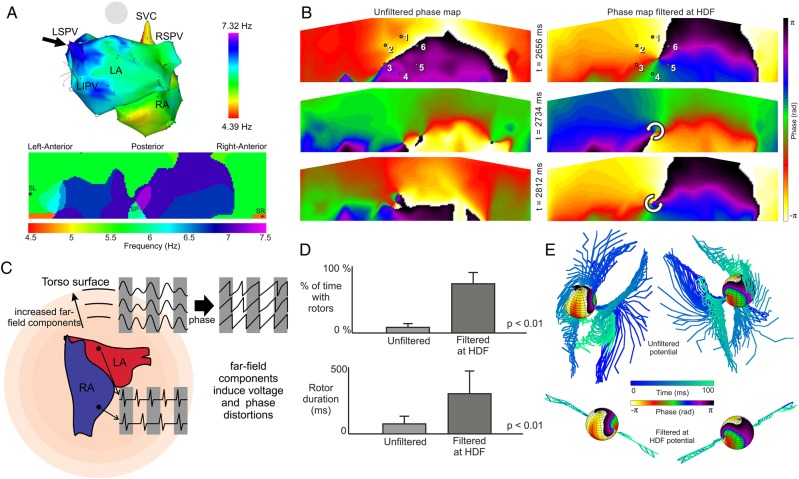
Rotor-guided ablation has opened new perspectives into the therapy of atrial fibrillation (AF). Analysis of the spatio-temporal cardiac excitation patterns in the frequency and phase domains has demonstrated the importance of rotors in research models of AF, however, the dynamics and role of rotors in human AF are still controversial. In this review, the current knowledge gained through research models and patient data that support the notion that rotors are key players in AF maintenance is summarized. We report and discuss discrepancies regarding rotor prevalence and stability in various studies, which can be attributed in part to methodological differences among mapping systems. Future research for validation and improvement of current clinical electrophysiology mapping technologies will be crucial for developing mechanistic-based selection and application of the best therapeutic strategy for individual AF patient, being it, pharmaceutical, ablative, or other approach.

Keywords: Atrial fibrillation; Body surface mapping; Dominant frequency; Fourier transform; Phase mapping; Rotors.


Figures

Figure 1
Figure 1
Current hypothesis for AF maintenance. (A) Diagram of AF maintenance near a PV that has been hypothesized to be driven by ectopic focus (left), rotors (middle), or multiple wavelets (right). Different wavefronts are represented in purple. (B) Representation of the compatibility of rotor maintenance with other mechanisms. Rotors can be initiated by wavebreaks near an ectopic focus (left) and underlie endocardial or epicardial breakthroughs (middle). A drifting rotor, whose trajectory is depicted in blue, can be the driver of multiple and apparently disorganized atrial wavelets (right).
Figure 2
Figure 2
Rotors and AF mechanisms. (A) Diagram of a hierarchical organization during AF driven by a fast rotor. Rotors, or reentries in general, present some spatiotemporal periodicity, and thus electrograms (EGMs) are regular. Spectral analysis identifies a dominant peak that matches the activation frequency of the rotor, which is the fastest across the atria. At the periphery of the rotor, propagation is disrupted as some activations are blocked. The variations in activation times and directions at the boundaries of the rotor result in EGMs with variable morphology and fractionation, with multiple peaks in the power spectrum. At more distal sites, the activation rate has been reduced leading to less wavebreaks and a more regular activity. (B) Isochrone map of optical activity shows an AF driver localized to the LA appendage in the form of a clockwise rotor (from Mandapati et al.). (C) DF maps of epicardial surfaces of LA and RA, with values of DFs along Bachmann's bundle (BB) and infero-posterior pathway (IPP), showing a DF decrement from LA to RA. Areas of colour frequency maps indicate optical mapping field. (Small areas in red have a frequency value of 60 Hz and represent noise artefact.) From Mansour et al. (D) Recordings from three electrodes along BB, bottom tracing being most leftward, showing directionality of activation from LA (fast DF) to RA (slow DF) (from Mansour et al.).
Figure 3
Figure 3
Rotor meandering and drift. (A) Optical mapping phase snapshot in isolated sheep heart during AF showing reentrant activity in the LA free wall. The time–space trajectory of the tip, the x and y coordinate signals, and their corresponding spectra are shown on the right. The meandering spectral peaks (FTip) contribute to the complexity of the local activity (from Zlochiver et al.). (B) Interaction between rotors and spontaneous breakthroughs in the setting of adrenocholinergic stimulation. A breakthrough induced substantial rotor drift as shown by corresponding PS trajectory for rotor 1, which was forced to drift downward and terminate after collision with counter-rotating rotor 2 (from Yamazaki et al.). (C) Diagram illustrating that the regularity of the electrograms recorded at the vicinity of a rotor core can be related to the rotor stability. A stationary rotor gives rise to regular activation (left) as opposed to a drifting rotor (right), which results in a gradual shortening of activation times when the rotor travels towards the recording electrode and a gradual lengthening of activation times when the rotor travels away from the recording site. (D) Left: trajectory of the tip of a computer-simulated drifting rotor (MR, yellow trace) superimposed on a snapshot of voltage at time zero. Red square: starting point of the drift; green dots: the location of the tip at the completion of each of nine initial rotations; blue square: location of bipoles 13 and 14 of 20-electrode catheter recording at the top-right area of the computer model; double-headed blue arrow: distance between bipoles 13 and 14 and the tip of the rotor. Right: systolic interval (SI) at bipoles 13 and 14 as a function of distance between the tip of the rotor and the location of the bipoles. As the drifting rotor gets closer to the bipoles, SI abbreviates due to Doppler shift. After the seventh rotation, local conduction impairment at 13 and 14 increases SI with an eventual wavebreak (WB). Bottom: traces of the pseudo-bipoles from the catheter at the top-right area of the computer model. Episode of irregular electrograms appears when WB with additional SPs (three SPs) occurs (between red lines) (from Atienza et al.).
Figure 4
Figure 4
Ionic mechanisms of rotor drift. (A) Funnel-shaped PV-LAJ models with homogeneous (left) and heterogeneous (right) ionic properties. Phase activity and SP trajectory are superimposed on the model. (B) Bull-eye view of the models in (A) with voltage snapshot (grey levels) and SP trajectories. Yellow arrows, distance between the SP and the PV. (C) The decreasing distance between the SP and the PV edge demonstrates a rotor attraction to the PV in the heterogeneous (red) but not in the homogeneous (blue) model (from Calvo et al.).
Figure 5
Figure 5
Increased DF during AF with ACh and adenosine. (A) Optical mapping of the LA and RA in isolated sheep heart. (Top) At 0.2 µM ACh, the domain frequencies as well as the frequency values and dispersion are greater in the LA than in the RA. (Bottom) At 4.0 µM ACh, the LA to RA difference in frequency and dispersion is larger, suggesting that ACh has a more pronounced effect on the LA (from Sarmast et al.). (B) LA posterior view DF map from a paroxysmal AF patient. The DF map was produced by the real-time frequency mapping CARTO system before infusion of adenosine (top), and the DFmax was measured again at peak adenosine effect (bottom). Red arrows indicate the primary DFmax site near the RIPV. DF maps and bipolar recording at the primary DFmax site show an increase in the DF in the presence of adenosine. LIPV, left inferior PV; RSPV, right superior PV; Bip, bipolar catheter. Reproduced from Atienza et al.
Figure 6
Figure 6
Organized activation patterns in relation to DF sites. (A) LA DF map (posterior view). White arrow points to HDF site (10.8 Hz) at the left inferior PV antrum. (B) Posterior LA wall activation map during organized phase before fragmentation (right) shows an incoming wave pattern of activation progressing from closest to the HDF site at the left inferior PV (left, white) to the right (purple-blue). (C) Snapshots of wave propagation at the PLAW during transitions to fragmentation. Sequences 1–6 (purple, resting regions; white, advancing activation) show clockwise reentrant activation around a pivoting point located to the right edge of the septopulmonary bundle. From Atienza et al.
Figure 7
Figure 7
Rotors driving AF in panoramic FIRM mapping in humans. (A) LA rotor with counterclockwise activation and disorganized RA during AF in a 60-year-old man. Ablation at LA rotor terminated AF to sinus rhythm in <1 min. The patient was AF free on implanted cardiac monitor at >1 year. (B) RA rotor (clockwise) and simultaneous LA focal impulse (arrowed) during persistent AF in a 47-year-old man. Ablation at RA rotor terminated AF to sinus rhythm in 5.5 min (from Narayan et al.).
Figure 8
Figure 8
Phase maps and analysis of ECGI data. (A) One of the two consecutive rotations involving the inferior LA and prephase electrograms around its core (sites 1–12). (B) One of the two consecutive rotations involving the posterior upper RA and prephase electrograms around its core (sites 1–12). (C) Top, distribution of drivers (focal breakthroughs, asterisk; reentry events, curved arrows) in seven regions is reported as the percentage of patients. For example, 82% of the 103 patients had repetitive reentries, and 58% had repetitive focal breakthroughs in left PV-appendage region. Bottom, the bar diagram shows the distribution of the mean number of rotations in 103 patients (from Haissaguerre et al.).
Figure 9
Figure 9
Body surface DF and phase mapping. (A) Sample correlation between intracardiac and body surface DF maps. Black arrows point to the matching HDFs at the left superior PV and at the centre of the posterior body surface DF (from Guillem et al.). (B) Surface phase maps at three selected times for unfiltered (left) and for HDF-filtered (right) surface potentials for a patient during AF. (C) Diagram illustrating the effect of the distance from the atrial sources and the instantaneous phase obtained from electrical recordings. The atria are depicted inside a volume conductor that represents the torso together with illustrative potentials that could be recorded at two atrial sites and at three virtual electrodes at increasing distances from the atria. At increasing distances from the atrial surface, distances from all atrial tissues become comparable and thus there are increasing far-field effects on the electrical recordings. The instantaneous phase of these electrical recordings is in turn also distorted. (D) Percentage of time with rotors (top) and rotor duration (bottom) in surface phase maps from unfiltered and HDF-filtered surface potentials over a cohort of 14 AF patients. (E) Phase map of computer-simulated epicardial sphere and temporal configuration of filaments inside the torso for unfiltered potentials and for HDF-filtered potentials (from Rodrigo et al.).

References

    1. Wann LS, Curtis AB, January CT, Ellenbogen KA, Lowe JE, Estes NA 3rd, Page RL, Ezekowitz MD, Slotwiner DJ, Jackman WM, Stevenson WG, Tracy CM, Writing Group M, Fuster V, Ryden LE, Cannom DS, Le Heuzey JY, Crijns HJ, Lowe JE, Curtis AB, Olsson S, Ellenbogen KA, Prystowsky EN, Halperin JL, Tamargo JL, Kay GN, Wann L, Writing Committee M, Jacobs AK, Anderson JL, Albert N, Hochman JS, Buller CE, Kushner FG, Creager MA, Ohman EM, Ettinger SM, Stevenson WG, Guyton RA, Tarkington LG, Halperin JL, Yancy CW, Members AATF. 2011 ACCF/AHA/HRS focused update on the management of patients with atrial fibrillation (updating the 2006 guideline): a report of the American College of Cardiology Foundation/American Heart Association task force on practice guidelines. Circulation 2011;123:104–123. - PubMed
    1. Dobrev D, Nattel S. New antiarrhythmic drugs for treatment of atrial fibrillation. Lancet 2010;375:1212–1223. - PubMed
    1. Wilber DJ, Pappone C, Neuzil P, De Paola A, Marchlinski F, Natale A, Macle L, Daoud EG, Calkins H, Hall B, Reddy V, Augello G, Reynolds MR, Vinekar C, Liu CY, Berry SM, Berry DA, ThermoCool AFTI. Comparison of antiarrhythmic drug therapy and radiofrequency catheter ablation in patients with paroxysmal atrial fibrillation: a randomized controlled trial. JAMA 2010;303:333–340. - PubMed
    1. Parkash R, Tang AS, Sapp JL, Wells G. Approach to the catheter ablation technique of paroxysmal and persistent atrial fibrillation: a meta-analysis of the randomized controlled trials. J Cardiovasc Electrophysiol 2011;22:729–738. - PubMed
    1. Cappato R, Calkins H, Chen SA, Davies W, Iesaka Y, Kalman J, Kim YH, Klein G, Natale A, Packer D, Skanes A, Ambrogi F, Biganzoli E. Updated worldwide survey on the methods, efficacy, and safety of catheter ablation for human atrial fibrillation. Circ Arrhythm Electrophysiol 2010;3:32–38. - PubMed

Publication types

MeSH terms