. 2017 Jan;72(1):16-29.
doi: 10.1093/gerona/glv232. Epub 2016 Jan 18.

CNS-wide Sexually Dimorphic Induction of the Major Histocompatibility Complex 1 Pathway With Aging

Affiliations

CNS-wide Sexually Dimorphic Induction of the Major Histocompatibility Complex 1 Pathway With Aging

Colleen A Mangold et al. J Gerontol A Biol Sci Med Sci. 2017 Jan.

Abstract

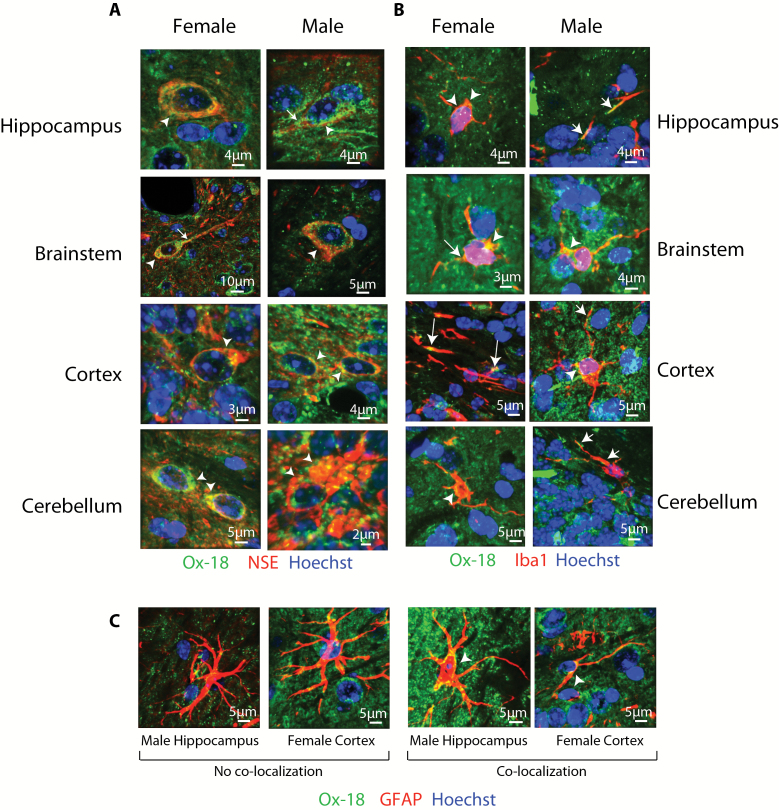
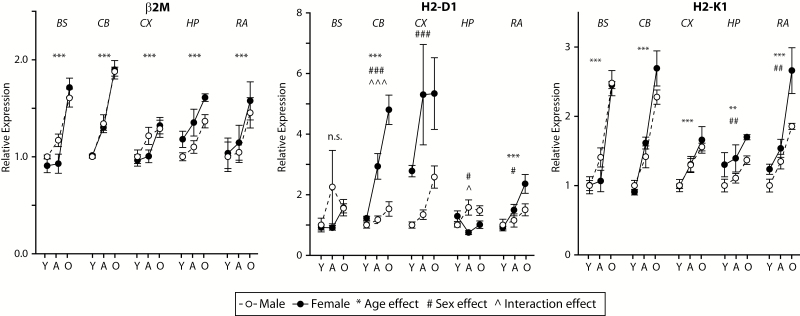
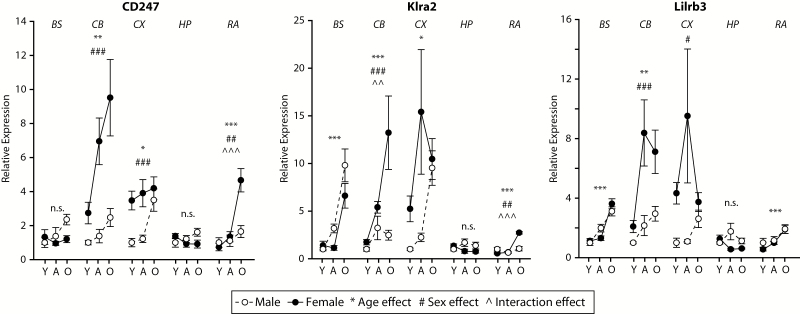
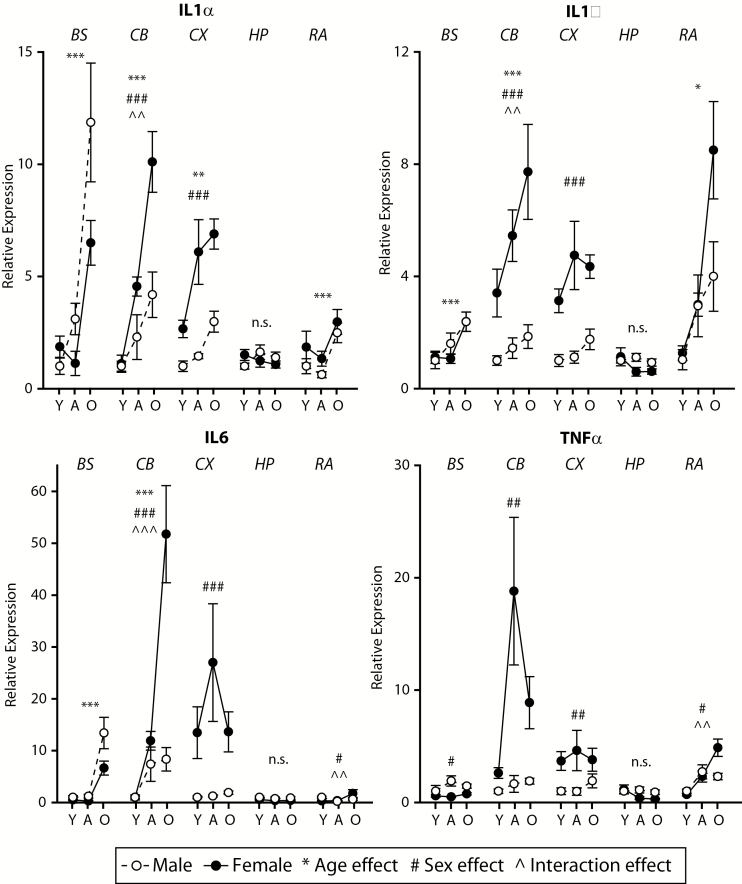
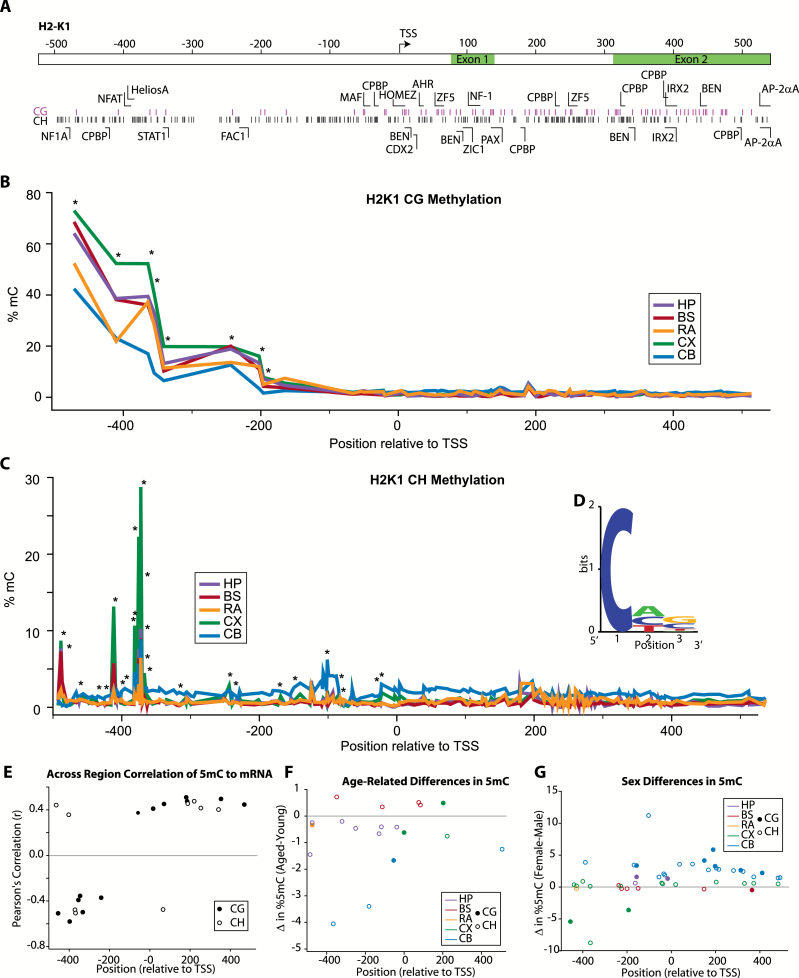
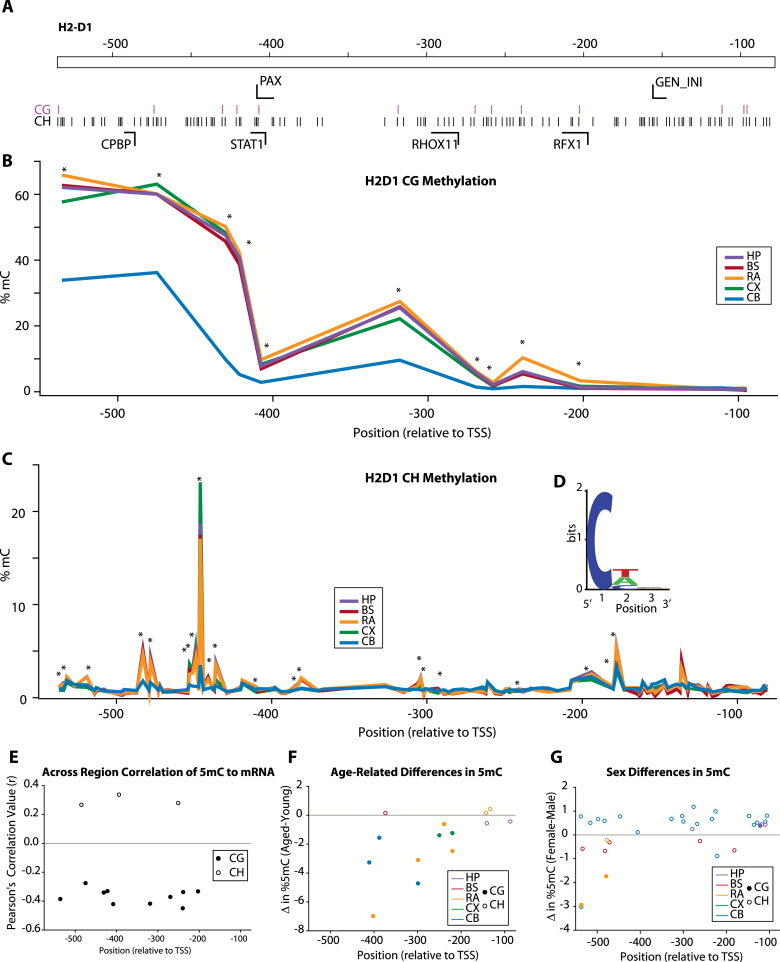
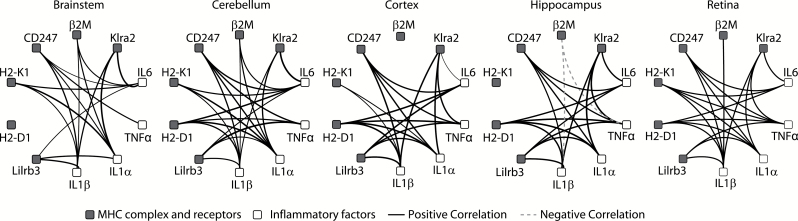
The major histocompatibility complex I (MHCI) pathway, which canonically functions in innate immune viral antigen presentation and detection, is functionally pleiotropic in the central nervous system (CNS). Alternative roles include developmental synapse pruning, regulation of synaptic plasticity, and inhibition of neuronal insulin signaling; all processes altered during brain aging. Upregulation of MHCI components with aging has been reported; however, no systematic examination of MHCI cellular localization, expression, and regulation across CNS regions, life span, and sexes has been reported. In the mouse, MHCI is expressed by neurons and microglia, and MHCI components and receptors (H2-K1, H2-D1, β2M, Lilrb3, Klra2, CD247) display markedly different expression profiles across the hippocampus, cortex, cerebellum, brainstem, and retina. MHCI components, receptors, associated inflammatory transcripts (IL1α, IL1β, IL6, TNFα), and TAP (transporter associated with antigen processing) components are induced with aging and to a greater degree in female than male mice across CNS regions. H2-K1 and H2-D1 expression is associated with differential CG and non-CG promoter methylation across CNS regions, ages, and between sexes, and concomitant increased expression of proinflammatory genes. Meta-analysis of human brain aging data also demonstrates age-related increases in MHCI. Induction of MHCI signaling could contribute to altered synapse regulation and impaired synaptic plasticity with aging.

Keywords: Aging; DNA methylation; Gene expression; MHCI; Sex differences; brain.


Figures

Figure 1.
Figure 1.
Cellular localization of MHCI in aged neurons, microglia, and astrocytes. (A) Neuronal localization of MHCI protein was observed in all tissues examined (brainstem, cerebellum, cortex, and hippocampus) in the aged (24 month) male and female brain. Ox-18 immunoreactivity was seen in neuronal cell bodies (arrowheads) and processes (arrows). Red NSE, green MHCI, blue Hoechst, yellow NSE/MHCI colocalization. (B) Lower levels of microglial localization of MHCI were evident in both the aged male and female brain. Microglial cell bodies are noted as arrowheads whereas processes are noted as arrows. Red Iba1, green MHCI, blue Hoechst, yellow Iba1/MHCI colocalization. (C) Astrocytic localization of MHCI across the brain in both aged male and female mice was rare and inconsistent. Red GFAP, green MHCI, blue Hoechst, yellow GFAP/MHCI colocalization.
Figure 2.
Figure 2.
MHCI complex expression increases with aging across the CNS. The invariant chain of MHCI (Beta-2 microglobulin, β2M) as well as the classical MHCI isoforms (H2-D1 and H2-K1) increase in expression with age across the CNS regions examined. While β2M did not show any sex effects, H2-D1 and H2-K1 demonstrate sex and interaction effects in a number of the brain regions examined. Y=Young, A=Adult, O=Old/Aged. Two-way analysis of variance (Age × Sex), **p < .01, ***p < .001 Age effect, ##p < .01, ###p < .001 Sex effect, ^p < .05, ^^^p < .001 interaction, Benjamini–Hochberg Multiple Testing Correction, n.s. not significant, n = 7–8/group.
Figure 3.
Figure 3.
MHCI receptor induction with aging and sex differences across CNS regions is distinct. Expression of the MHCI receptors, CD247, Klra2, and Lilrb3 are induced with aging in most of the brain regions examined with the exception of the hippocampus. In some regions, for example, cortex and cerebellum, significantly higher expression was evident in females. Y=Young, A=Adult, O=Old/Aged. Two-way analysis of variance (Age × Sex), **p < .01, ***p < .001 Age effect, ## p < .01, ### p < .001 Sex effect, ^p < .05, ^^^p < .001 interaction, Benjamini–Hochberg Multiple Testing Correction, n.s. not significant, n = 7–8/group (age/sex/region).
Figure 4.
Figure 4.
Sexually dimorphic inductions of inflammatory gene expression with advanced age across neural tissues. The inflammatory factors IL1α, IL1β, IL6, and TNFα demonstrated high levels of induction with aging, in many cases much higher in females than males. Y=Young, A=Adult, O=Old/Aged. Two-way analysis of variance (Age × Sex), **p < .01, ***p < .001 Age effect, ## p < .01, ### p < .001 Sex effect, ^p < .05, ^^^p < .001 interaction, Benjamini–Hochberg Multiple Testing Correction, n.s. not significant, n = 7–8/group (age/sex/region).
Figure 5.
Figure 5.
CG and non-CG methylation of H2-K1 promoter and intragenic regions. (A) Schematic of region analyzed, locations of CG and non-CG sites, and transcription factor binding domains. (B) Topography of site-specific CG methylation level in H2-K1 for each of the CNS regions analyzed. Average methylation at each site is presented. Sites with differential methylation between regions (one-way ANOVA, *p < .05) are noted. (C) Low levels of non-CG methylation were detected with the exception of specific peaks of higher (>5%) methylation. Average methylation at each site is presented. Sites with differential methylation between regions (one-way ANOVA, *p < .05) are noted. (D) Non-CG methylation has been proposed to be enriched in specific motifs, and the enrichment of specific nucleotides was examined for the non-CG sites with the highest (>average for the region examined) methylation levels. (E) H2-K1 expression across CNS regions was correlated to paired methylation levels from the same animals at specific CG and non-CG sites. Only young animals were analyzed to control for age-related differences in gene expression. Among sites with significant correlations (Pearson correlation α > 0.05 r > |0.25|), methylation at CG and CH sites in the promoter region was overall negatively correlated with gene expression, whereas methylation at intragenic CG and CH sites was positively correlated. (F) Age- and (G) sex-related differences in CG and non-CG methylation levels were evident across the H2-K1 region examined. Overall, observed age-specific differences were primarily decreases in methylation with increased age. The majority of differences in methylation observed between sexes were increases in methylation in females vs. males. Only sites with statistically significant differences are shown [two-way ANOVA (Age × Sex), Student–Newman–Keuls post hoc p < .05 within each CNS region], sites are color coded by brain region examined (HP-hippocampus, BS-brainstem, RA-retina, CX-cortex, CB-cerebellum) and whether the site is a CG (filled circle) or non-CG/CH (open circle) is noted. n = 3–4/group (age/sex/region).
Figure 6.
Figure 6.
CG and non-CG methylation of H2-D1 promoter region. (A) Schematic of region analyzed, locations of CG and non-CG sites, and transcription factor binding domains. (B) Topography of site-specific CG methylation levels in H2-D1 for each of the CNS regions analyzed. Average methylation at each site is presented. Sites with differential methylation between regions [one-way ANOVA, *p < .05] are noted. (C) Low levels of non-CG methylation were detected with the exception of specific peaks of higher (>5%) methylation. Average methylation at each site is presented. Sites with differential methylation between regions (one-way ANOVA, *p < .05) are noted. (D) Non-CG methylation has been proposed to be enriched in specific motifs, and the enrichment of specific nucleotides was examined for the non-CG sites with the highest (>average for the region examined) methylation levels. (E) H2-D1 expression across CNS regions was correlated to paired methylation levels from the same animals at specific CG and non-CG sites. Only young animals were analyzed to control for age-related differences in gene expression. Among sites with significant correlations (Pearson correlation α > 0.05 r > |0.25|), methylation at CG and CH sites in the promoter region was overall negatively correlated with gene expression, whereas methylation at intragenic CG and CH sites was positively correlated. (F) Age and (G) sex-related differences in CG and non-CG methylation levels were evident across the H2-D1 region examined. Overall, observed age-specific differences were primarily decreases in methylation with increased age. The majority of differences in methylation observed between sexes were increases in methylation in females vs. males. Only sites with statistically significant differences are shown [two-way ANOVA (Age × Sex), Student–Newman–Keuls post hoc p < .05 within each CNS region], sites are color coded by brain region examined (HP-hippocampus, BS-brainstem, RA-retina, CX-cortex, CB-cerebellum) and whether the site is a CG (filled circle) or non-CG/CH (open circle) is noted. n = 3–4/group (age/sex/region).
Figure 7.
Figure 7.
Correlated gene expression between MHCI components, receptors, and inflammatory factors. (A) Significant correlations between expression of MHCI components and receptors (gray) and inflammatory mediators (white). (B) Significant correlations between expression of MHCI components (dark gray) and receptors (white). All black lines represent positive significant correlations (Pearson’s p < .05), and all dashed lines represent negative significant correlations, following multiple testing correction (Benjamini–Hochberg multiple testing correction), and line width is proportional to correlation coefficient values.

References

    1. Lucin KM, Wyss-Coray T. Immune activation in brain aging and neurodegeneration: too much or too little? Neuron. 2009;64:110–122. doi:10.1016/j.neuron.2009.08.039 - PMC - PubMed
    1. Hedden T, Gabrieli JD. Insights into the ageing mind: a view from cognitive neuroscience. Nat Rev Neurosci. 2004;5:87–96. doi:10.1038/nrn1323 - PubMed
    1. Joly E, Mucke L, Oldstone MB. Viral persistence in neurons explained by lack of major histocompatibility class I expression. Science. 1991;253:1283–1285. - PubMed
    1. Neuwelt EA, Clark WK. Unique aspects of central nervous system immunology. Neurosurgery. 1978;3:419–430. - PubMed
    1. Neefjes J, Jongsma ML, Paul P, Bakke O. Towards a systems understanding of MHC class I and MHC class II antigen presentation. Nat Rev Immunol. 2011;11:823–836. doi:10.1038/nri3084 - PubMed

Publication types