. 2016;11(1):61-73.
doi: 10.1080/15592294.2015.1137414. Epub 2016 Jan 19.

Gene promoter methylation signature predicts survival of head and neck squamous cell carcinoma patients

Affiliations

Gene promoter methylation signature predicts survival of head and neck squamous cell carcinoma patients

Efterpi Kostareli et al. Epigenetics. 2016.

Abstract

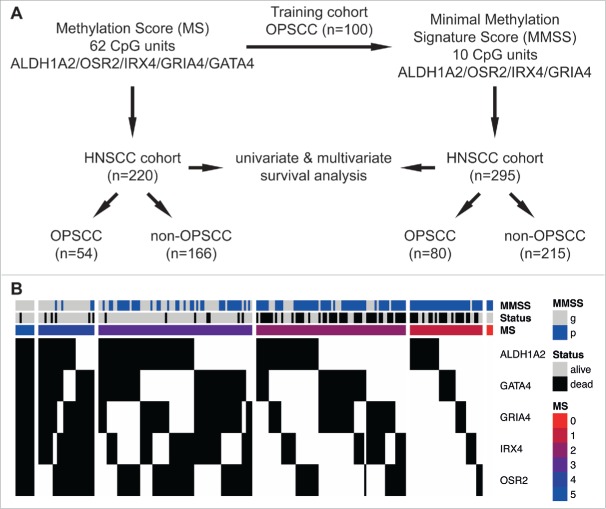
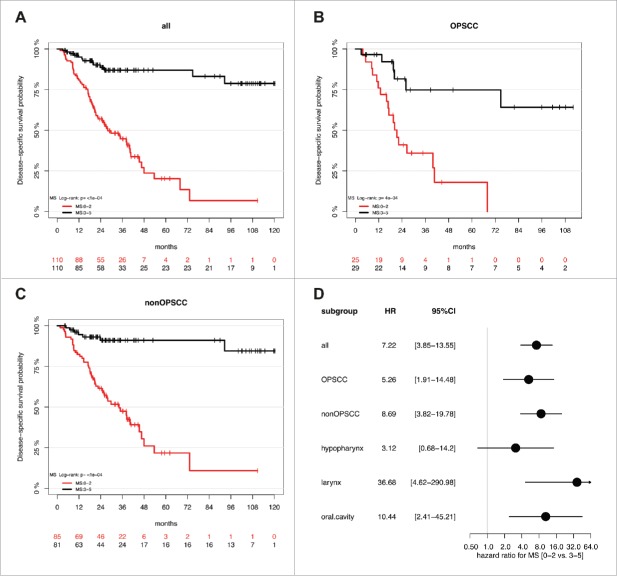
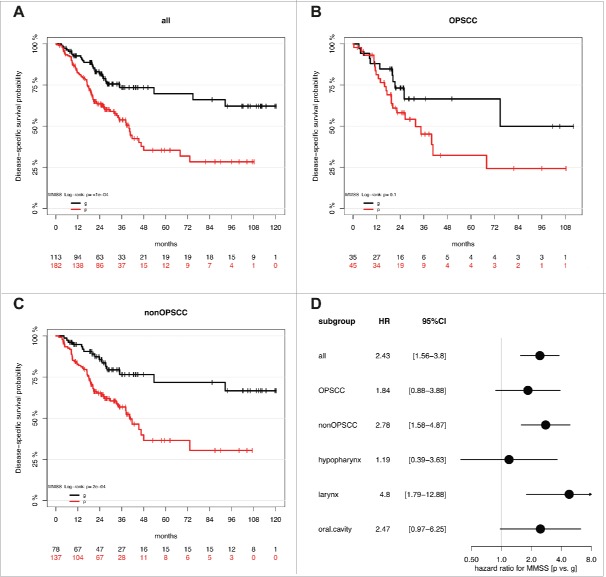
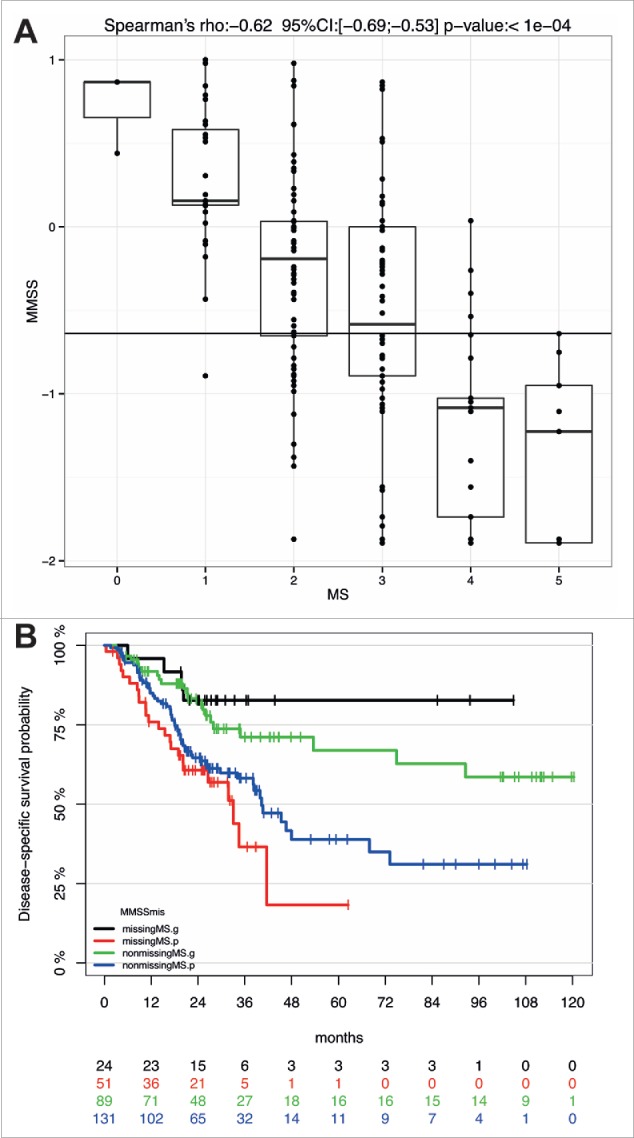
Infection with high-risk types of human papilloma virus (HPV) is currently the best-established prognostic marker for head and neck squamous cell carcinoma (HNSCC), one of the most common and lethal human malignancies worldwide. Clinical trials have been launched to address the concept of treatment de-escalation for HPV-positive HNSCC with the final aim to reduce treatment related toxicity and debilitating long-term impacts on the quality of life. However, HPV-related tumors are mainly restricted to oropharyngeal SCC (OPSCC) and there is an urgent need to establish reliable biomarkers for all patients at high risk for treatment failure. A patient cohort (n = 295) with mainly non-OPSCC (72.9%) and a low prevalence of HPV16-related tumors (8.8%) was analyzed by MassARRAY to determine a previously established prognostic methylation score (MS). Kaplan-Meier revealed a highly significant correlation between a high MS and a favorable survival for OPSCC (P = 0.0004) and for non-OPSCC (P<0.0001), which was confirmed for all HNSCC by multivariate Cox regression models (HR: 9.67, 95% CI [4.61-20.30], P<0.0001). Next, we established a minimal methylation signature score (MMSS), which consists of ten most informative of the originally 62 CpG units used for the MS. The prognostic value of the MMSS was confirmed by Kaplan-Meier analysis for all HNSCC (P<0.0001) and non-OPSCC (P = 0.0002), and was supported by multivariate Cox regression models for all HNSCC (HR: 2.15, 95% CI [1.36-3.41], P = 0.001). In summary, the MS and the MMSS exhibit an excellent performance as prognosticators for survival, which is not limited by the anatomical site, and both could be implemented in future clinical trials.

Keywords: DNA methylation; HNSCC; HPV; MassARRAY; OPSCC; head and neck cancer; squamous cell carcinoma.


Figures

Figure 1.
Figure 1.
Schematic representation of the study design and association between the MS, the MMSS and the survival status of HNSCC patients. (A) The MS was evaluated based on quantitative MassARRAY data of 62 CpG units in proximal promoters of ALDH1A2, OSR2, IRX4, GRIA4 and GATA4 as described previously , and revealed informative data for 220 patients of the HNSCC cohort (n = 54 OPSCC and n = 166 non-OPSCC). The MMSS was established as a less complex signature, consisting of the 10 most informative CpG units in proximal promoters of ALDH1A2, OSR2, IRX4 and GRIA4, with data of the training cohort (n = 100; 25), and was applied on patients of the HNSCC cohort (n = 295 with n = 80 OPSCC and n = 215 non-OPSCC). Univariate and multivariate survival analysis was conducted to confirm prognostic effects of MS and MMSS. (B) Heatmap summarizing the MS, the MMSS and the survival status of HNSCC patients. Each column indicates a patient of the HNSCC cohort (n = 220) and the methylation status according to the established pattern ALDH1A2low, OSR2low, GATA4high, GRIA4high, IRX4high for favorable prognosis is indicated in black (congruent) or white (non-congruent). The colored bars indicate the final value for MS and the MMSS is depicted in blue (MMSS_p) or gray (MMSS_g). The survival status is indicated in gray (alive) or black (dead).
Figure 2.
Figure 2.
A high MS serves as prognostic biomarker for favorable survival in a HNSCC cohort. Kaplan-Meier plots demonstrate an improved survival of the MS3-5 (black line) as compared to the MS0-2 subgroup (red line), which is highly significant for all HNSSC patient (n = 220, A), as well as for the subgroup of patients with either OPSCC (n = 54, B) or non-OPSCC (n = 166, C). (D) The Forest plot displays the relative strength of prognostic effects as HR and 95% CI according to the methylation subgroup (MS0-2 vs. MS3-5) on disease-specific survival for all HNSCC (n = 220), and subgroup of patients with OPSCC (n = 54), non-OPSCC (n = 166), hypopharyngeal (n = 30), laryngeal (n = 69) and oral SCC (n = 63).
Figure 3.
Figure 3.
The MMSS_g serves as prognostic biomarker for favorable survival in a HNSCC cohort. Kaplan-Meier plots demonstrate an improved survival of the MMSS_g (black line) as compared to the MMSS_p subgroup (red line), which is highly significant for all HNSSC patient (n = 295, A), as well as for the subgroup of patients with non-OPSCC (n = 215, C). (D) The Forest plot displays the relative strength of the prognostic effects as HR and 95% CI according to the methylation subgroup (MMSS_p vs. MMSS_g) on disease-specific survival for all HNSCC (n = 295), and subgroup of patients with OPSCC (n = 80), non-OPSCC (n = 215), hypopharyngeal (n = 37), laryngeal (n = 93) and oral SCC (n = 80).
Figure 4.
Figure 4.
The MMSS reliably predicts survival of HNSCC patients with a missing MS. (A) Comparative analysis of MS and MMSS values for all HNSCC patients (n = 220) for which data for both methylation scores were available. (B) The Kaplan-Meier plot demonstrates the prognostic value of the MMSS_g to predict improved survival of HNSCC patient with available MS (n = 89, green line) as well as those with a missing MS (n = 24, black line). The MMSS_p is associated with an unfavorable survival, which is displayed for HNSCC patients with an available MS (blue line) and those with a missing MS (red line).

References

    1. Leemans CR, Braakhuis BJ, Brakenhoff RH. The molecular biology of head and neck cancer. Nat Rev Cancer 2011; 11:9-22; PMID:21160525; http://dx.doi.org/ 10.1038/nrc2982 - DOI - PubMed
    1. Ndiaye C, Mena M, Alemany L, Arbyn M, Castellsague X, Laporte L, Bosch FX, de Sanjose S, Trottier H. HPV DNA, E6/E7 mRNA, and p16INK4a detection in head and neck cancers: a systematic review and meta-analysis. Lancet Oncol 2014; 15:1319-31; PMID:25439690; http://dx.doi.org/ 10.1016/S1470-2045(14)70471-1 - DOI - PubMed
    1. Mehanna H, Beech T, Nicholson T, El-Hariry I, McConkey C, Paleri V, Roberts S. Prevalence of human papillomavirus in oropharyngeal and nonoropharyngeal head and neck cancer–systematic review and meta-analysis of trends by time and region. Head Neck 2013; 35:747-55; PMID:22267298; http://dx.doi.org/ 10.1002/hed.22015 - DOI - PubMed
    1. Network CGA. Comprehensive genomic characterization of head and neck squamous cell carcinomas. Nature 2015; 517:576-82; PMID:25631445; http://dx.doi.org/ 10.1038/nature14129 - DOI - PMC - PubMed
    1. Kostareli E, Holzinger D, Hess J. New concepts for translational head and neck oncology: lessons from HPV-related oropharyngeal squamous cell carcinomas. Front Head Neck Cancer 2012; 2:1-10 - PMC - PubMed

Publication types

Substances