. 2016 Mar;22(3):428-42.
doi: 10.1261/rna.053942.115. Epub 2016 Jan 19.

Oligoadenylation of 3' decay intermediates promotes cytoplasmic mRNA degradation in Drosophila cells

Affiliations

Oligoadenylation of 3' decay intermediates promotes cytoplasmic mRNA degradation in Drosophila cells

Christiane Harnisch et al. RNA. 2016 Mar.

Abstract

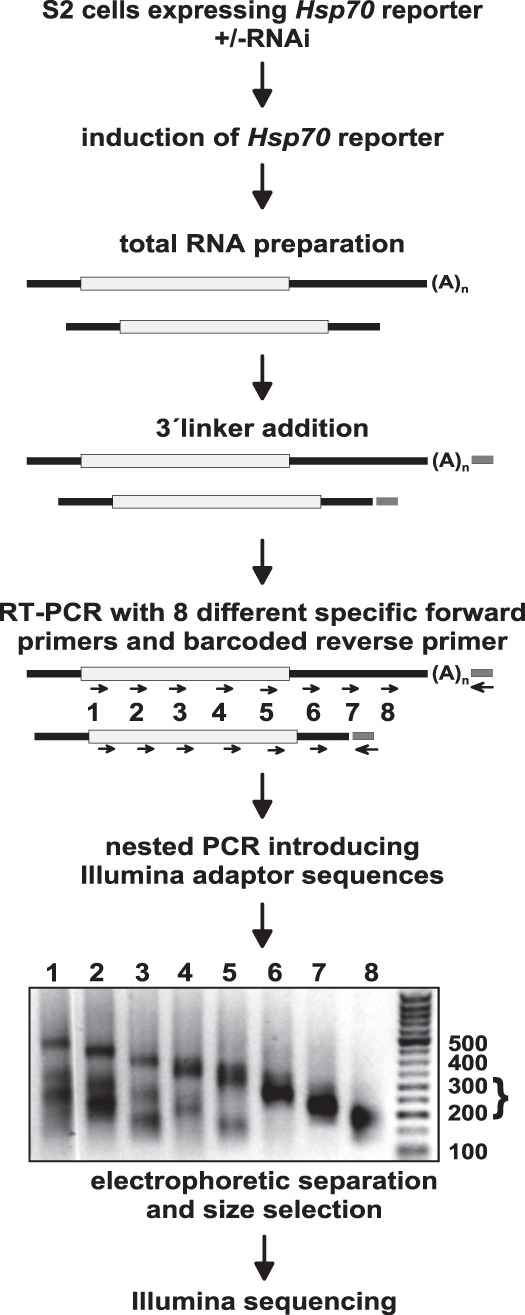
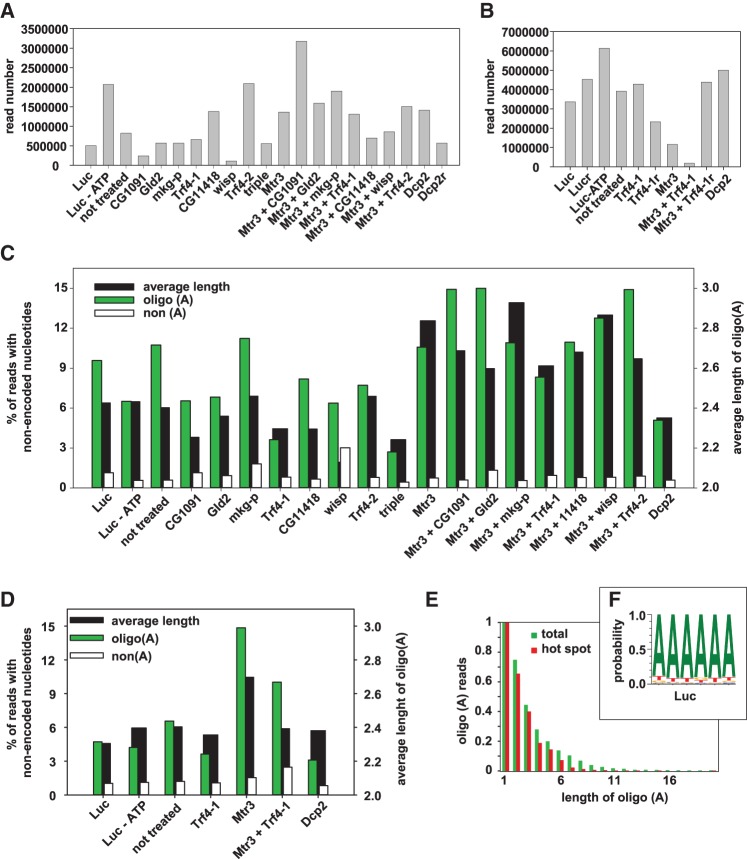
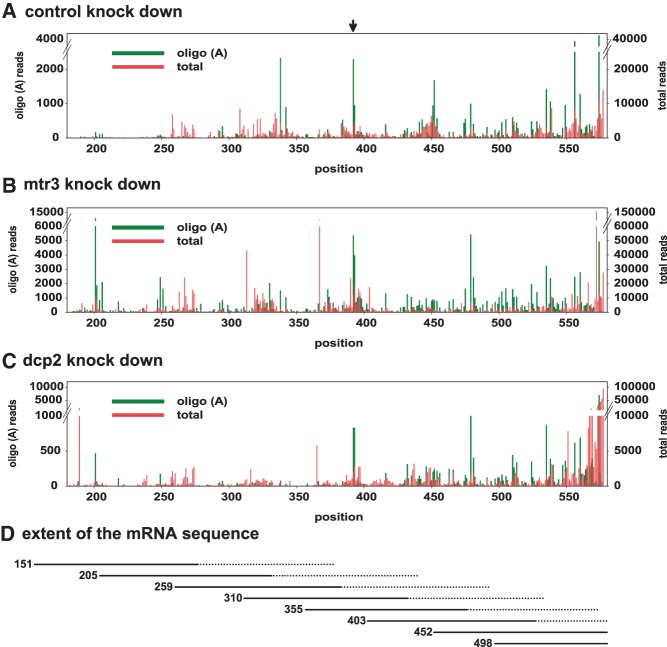
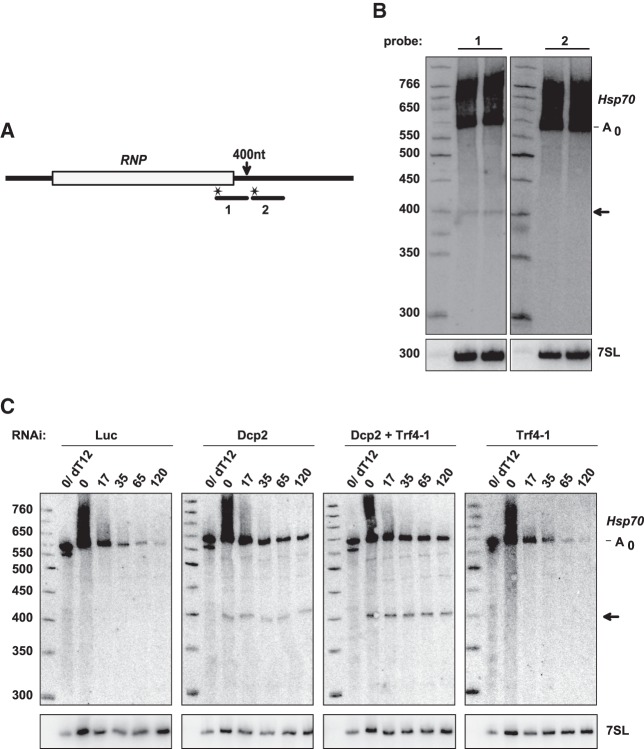
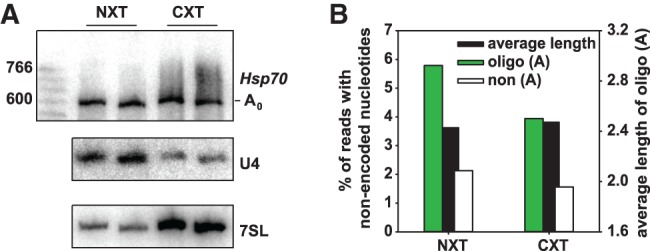
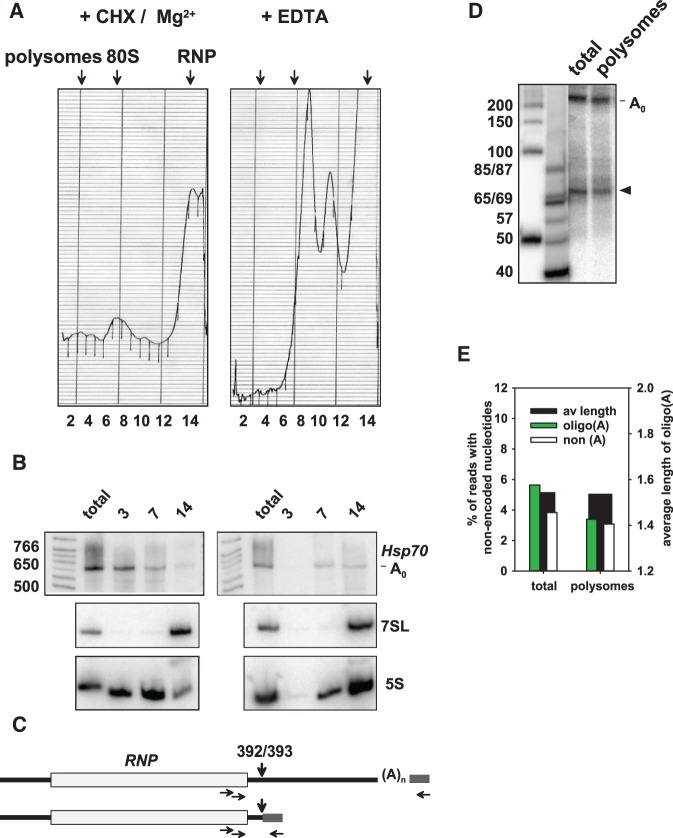
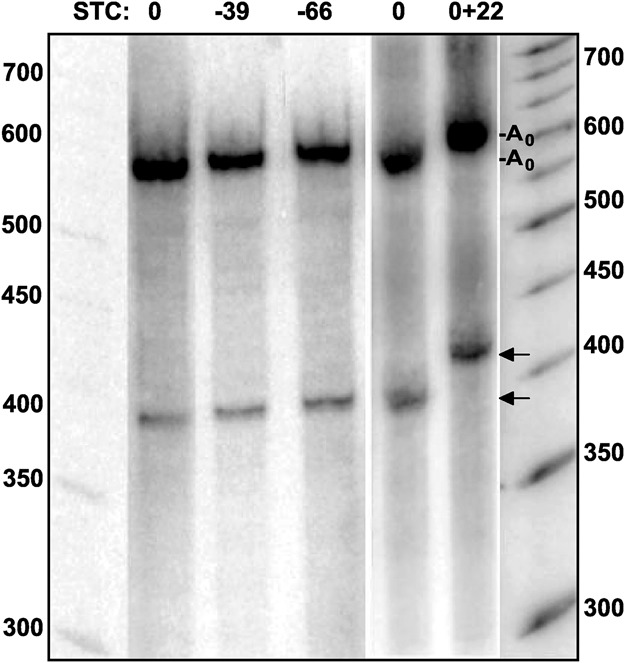
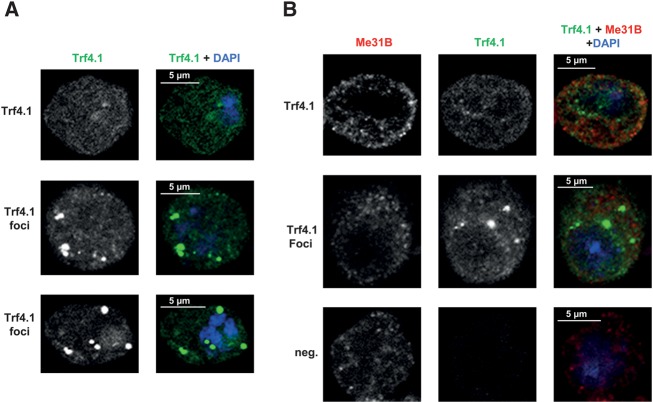
Post-transcriptional 3' end addition of nucleotides is important in a variety of RNA decay pathways. We have examined the 3' end addition of nucleotides during the decay of the Hsp70 mRNA and a corresponding reporter RNA in Drosophila S2 cells by conventional sequencing of cDNAs obtained after mRNA circularization and by deep sequencing of dedicated libraries enriched for 3' decay intermediates along the length of the mRNA. Approximately 5%-10% of 3' decay intermediates carried nonencoded oligo(A) tails with a mean length of 2-3 nucleotides. RNAi experiments showed that the oligoadenylated RNA fragments were intermediates of exosomal decay and the noncanonical poly(A) polymerase Trf4-1 was mainly responsible for A addition. A hot spot of A addition corresponded to an intermediate of 3' decay that accumulated upon inhibition of decapping, and knockdown of Trf4-1 increased the abundance of this intermediate, suggesting that oligoadenylation facilitates 3' decay. Oligoadenylated 3' decay intermediates were found in the cytoplasmic fraction in association with ribosomes, and fluorescence microscopy revealed a cytoplasmic localization of Trf4-1. Thus, oligoadenylation enhances exosomal mRNA degradation in the cytoplasm.

Keywords: exosome; mRNA decay; noncanonical poly(A) polymerase; oligoadenylation.


Figures

FIGURE 1.
FIGURE 1.
Library preparation for Illumina sequencing. S2 cells expressing the inducible Hsp70 reporter were treated with dsRNA as indicated in the text. Reporter gene transcription was induced with CuSO4 for 1 h, and total RNA was isolated. After barcoded linker addition, PCR was performed as indicated. A size selection (bracket) was performed for products of 200–300 nt, which were subsequently analyzed by Illumina sequencing.
FIGURE 2.
FIGURE 2.
Illumina sequencing analysis of nonencoded 3′ nucleotides. Data were obtained by the procedure outlined in Figure 1. Labels at the bottom of each figure refer to the dsRNA treatment. Luc, luciferase RNA control; not treated, no dsRNA added; luc-ATP, cells treated with luciferase control RNA and adaptor ligation carried out in the absence of ATP (see Materials and Methods); triple, combined knockdown of CG1091, mkg-p, and Trf4-1. (A) Read numbers of individual sequencing libraries in the first and (B) in the second experiment. In B, samples “Luc r” and “Mtr3 + Trf4-1 r” are technical replicates of the respective preceding sample. (C) Summary of nonencoded 3′ nucleotides in the first and (D) in the second experiment. In D, two samples are averages of two technical replicates as explained for B. (E) Length distributions of oligo(A) tails summarized over the three control libraries of Figure 2C at all internal positions [i.e., excluding the regular poly(A) tail] and at the 392/393 hot spot. The number of tails consisting of a single A was set to 1. This plot represents the length distribution up to 20 nt. Note that in all other analyses, only extensions up to 6 nt were included as explained in Materials and Methods. (F) Sequence composition of the nonencoded 3′ extensions in the luciferase control knockdown experiment represented as sequence logo. For this analysis, tails of between one and six nonencoded nucleotides were used independently of their sequence. Only tails from internal positions were used, i.e., the regular poly(A) tail was excluded from the analysis.
FIGURE 3.
FIGURE 3.
Distribution of oligoadenylated 3′ ends along the reporter mRNA. (A) Distribution of 3′ ends of total sequence reads (red) and of oligoadenylated sequence reads (green) over the reporter mRNA sequence in the luciferase control. Green bars represent the last encoded nucleotide in the sequence read, i.e., the position to which the A tail is added. A hot spot consistently observed at nucleotides 392/393 is indicated with an arrow. Sequence representation ends at the “regular” poly(A) addition site at position 577. Numbering of the sequence is based on the transcription start site reported by the supplier of the pMT/V5 vector; note that the transcription start site identified by the cRT-PCR analysis is 3 nt downstream (Supplemental Table II). (B) The same type of data is displayed for the Mtr3 knockdown. (C) The same type of data is displayed for the Dcp2 knockdown. All data are taken from the experiment shown in Figure 2A,C. (D) Approximate extent of the mRNA sequence covered by the deep sequencing libraries. The numbers on the left indicate the first nucleotide of the second (nested) upstream primer, defining the upper end of the sequence. The lower end depended on the gel purification procedure and is thus less precisely defined, as indicated by the dotted lines.
FIGURE 4.
FIGURE 4.
An intermediate of 3′ decay accumulates upon knockdown of Trf4-1. (A) The scheme of the reporter RNA and probes used for the Northern blot. The arrow indicates the position of the approximate 3′ end of the main 3′ decay intermediate visible in Northern blots. (B) S2 cells expressing the Hsp70 reporter were treated with Dcp2 dsRNA. Total RNA was isolated and analyzed by Northern blotting with the probes depicted in A. The ∼400 nt fragment (arrow) was detectable only with probe 1, but not with probe 2. Identification of the deadenylated RNA species is based on comparison to RNaseH/oligo(dT) digestions such as shown in C. (C) S2 cells expressing the Hsp70 reporter were treated with dsRNA against Dcp2 and/or Trf4-1 as indicated. Reporter transcription was induced and inhibited by actinomycin D after 60 min. Total RNA was isolated at the indicated time points after actinomycin D addition and analyzed by Northern blotting with a reporter-specific probe. For quantitation, the intensity of the ∼400 nt 3′ decay intermediate (arrow) was normalized to the intensity of the fully deadenylated decay intermediate (A0).
FIGURE 5.
FIGURE 5.
Oligoadenylated 3′ decay intermediates are present in cytoplasmic RNA. Transcription of the Hsp70 reporter was induced for 60 min before cytoplasmic and nuclear RNA was isolated as described in Materials and Methods. (A) The RNA was analyzed by Northern blotting with a reporter-specific probe and probes for U4 and 7SL RNA as markers for the nuclear and cytoplasmic fraction, respectively. The degree of enrichment was calculated from a comparison to additional lanes on the same Northern blot in which total RNA prepared from the same batch of cells was analyzed for U4 and 7SL RNA. (B) Sequencing libraries were generated from the same samples and analyzed by Illumina deep sequencing. Data represent between 1.3 and 2.9 million reads per sample and are averaged from the two independent experiments. The analysis of total RNA from the same cell sample is presented as “not treated” in Figure 2D.
FIGURE 6.
FIGURE 6.
Oligoadenylated 3′ decay intermediates are present on polysomes. (A) Cytoplasmic extract was prepared from S2 cells expressing the Hsp70 reporter and fractioned by sucrose gradient centrifugation (see Materials and Methods). The panel on the left shows the UV trace of a sample from cycloheximide-treated cells analyzed in the presence of Mg2+; the panel on the right shows the UV trace of a comparable sample from cells not treated with cycloheximide and mixed with EDTA to disrupt ribosomes. (B) RNA was isolated from fractions 3, 7, and 14 of the gradients shown in A and analyzed by Northern blotting. 7SL RNA and 5S RNA were used as markers for the RNP fraction and ribosomes, respectively. (C) An RT-PCR procedure as outlined in Figure 1 was used to generate sequencing libraries. A single nested pair of upstream primers was used. The scheme shows how the two main products were generated by adaptors ligated to the completely deadenylated full-length RNA and to the 3′ decay intermediate at nt 392/393. (D) For analytical purposes, the same PCR was carried out with [α-32P]-dCTP, and the products were separated on a denaturing polyacrylamide gel and analyzed by phosphorimaging. Marker sizes are indicated on the left. The main product corresponds to the size expected for amplification of full-length RNA. The second most abundant product (arrowhead) corresponds to the size expected for amplification of the fragment terminating at nt 392/393. (E) Total RNA and polysomal RNA was analyzed by Illumina sequencing. Read numbers obtained were between 303,000 and 518,000 per sequencing library. The data were averaged from two independent experiments.
FIGURE 7.
FIGURE 7.
The size of the 3′ decay intermediate is independent of the stop codon. Three variants of the Hsp70 reporter construct carrying the translation stop codon at different locations were used. The position of the stop codon is indicated on top: wild-type position (0), 39 nt and 66 nt upstream. A reporter variant with a 22 nt insertion immediately downstream from the stop codon was also used. S2 cells stably transformed with the constructs were treated with the Dcp2 dsRNA. Transcription of the reporter was induced by addition of 0.5 mM CuSO4. After 1 h, total RNA was isolated and analyzed by Northern blot. DNA probes were directed against reporter regions 1–51 (0+22) and 350–400 (0, −39 and −66). Because of the unexpected result, reporter mRNA was amplified from the experimental samples and the positions of the stop codons were confirmed by sequencing.
FIGURE 8.
FIGURE 8.
The Trf4-1 protein is localized in the cytoplasm. (A) Confocal images of S2 cells transiently expressing the C-terminally YFP-tagged Trf4-1 (green). A wide cytoplasmic distribution of the protein is depicted in the upper panel. The two lower panels show the enrichment of the protein in small cytoplasmic foci. DAPI was included in the mounting medium to label the nuclei (blue). (B) Trf4-1-YFP foci are not P bodies. S2 cells transiently expressing Trf4-1-YFP (green) were stained with an antibody against Me31B. The secondary antibody was Cy3 labeled (red). Cells containing a wide distribution (upper panel) and cytoplasmic foci (middle panel) of Trf4-1-YFP are shown. An untransfected cell was included as a negative control (lower panel). DAPI staining is shown in blue. Note that plasmid yields of the original Trf4-1 clone and the Trf4-1-YFP clone were always poor, and cells containing the latter either failed to grow in liquid culture or did not grow to normal densities. As this suggests selection pressure on the plasmids, the correct sequence of the Trf4-1-YFP clone was verified in the preparation used for the transfection experiment shown here.

References

    1. Antic S, Wolfinger MT, Skucha A, Hosiner S, Dorner S. 2015. General and microRNA-mediated mRNA degradation occurs on ribosome complexes in Drosophila cells. Mol Cell Biol 35: 2309–2320. - PMC - PubMed
    1. Arava Y, Boas FE, Brown PO, Herschlag D. 2005. Dissecting eukaryotic translation and its control by ribosome density mapping. Nucleic Acids Res 33: 2421–2432. - PMC - PubMed
    1. Behm-Ansmant I, Rehwinkel J, Doerks T, Stark A, Bork P, Izaurralde E. 2006. mRNA degradation by miRNAs and GW182 requires both CCR4:NOT deadenylase and DCP1:DCP2 decapping complexes. Genes Dev 20: 1885–1898. - PMC - PubMed
    1. Benoit P, Papin C, Kwak JE, Wickens M, Simonelig M. 2008. PAP- and GLD-2-type poly(A) polymerases are required sequentially in cytoplasmic polyadenylation and oogenesis in Drosophila. Development 135: 1969–1979. - PMC - PubMed
    1. Berndt H, Harnisch C, Rammelt C, Stöhr N, Zirkel A, Dohm JC, Himmelbauer H, Tavanez J-P, Hüttelmaier S, Wahle E. 2012. Maturation of mammalian H/ACA box snoRNAs: PAPD5-dependent adenylation and PARN-dependent trimming. RNA 18: 958–972. - PMC - PubMed

Publication types