. 2016 Jan 20:6:19274.
doi: 10.1038/srep19274.

Analysis of spatial-temporal gene expression patterns reveals dynamics and regionalization in developing mouse brain

Affiliations

Analysis of spatial-temporal gene expression patterns reveals dynamics and regionalization in developing mouse brain

Shen-Ju Chou et al. Sci Rep. .

Abstract

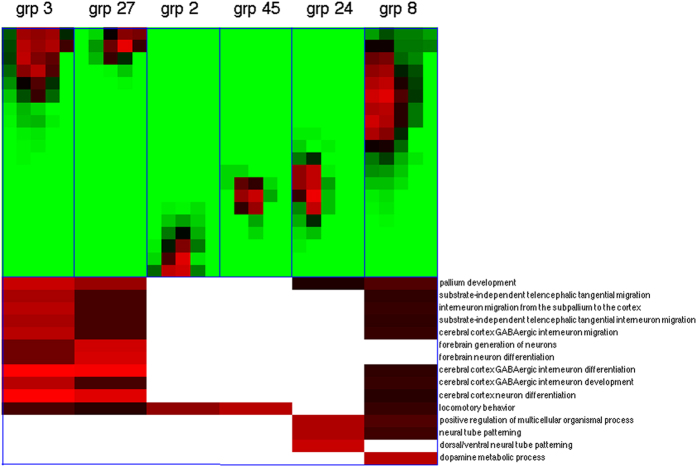
Allen Brain Atlas (ABA) provides a valuable resource of spatial/temporal gene expressions in mammalian brains. Despite rich information extracted from this database, current analyses suffer from several limitations. First, most studies are either gene-centric or region-centric, thus are inadequate to capture the superposition of multiple spatial-temporal patterns. Second, standard tools of expression analysis such as matrix factorization can capture those patterns but do not explicitly incorporate spatial dependency. To overcome those limitations, we proposed a computational method to detect recurrent patterns in the spatial-temporal gene expression data of developing mouse brains. We demonstrated that regional distinction in brain development could be revealed by localized gene expression patterns. The patterns expressed in the forebrain, medullary and pontomedullary, and basal ganglia are enriched with genes involved in forebrain development, locomotory behavior, and dopamine metabolism respectively. In addition, the timing of global gene expression patterns reflects the general trends of molecular events in mouse brain development. Furthermore, we validated functional implications of the inferred patterns by showing genes sharing similar spatial-temporal expression patterns with Lhx2 exhibited differential expression in the embryonic forebrains of Lhx2 mutant mice. These analysis outcomes confirm the utility of recurrent expression patterns in studying brain development.


Figures

Figure 1
Figure 1. Illustration of quantization for ABA gene expression data.
(a) A rectangular grid derived from the level 5 substructures. Left: forebrain (anterior), right: hindbrain (posterior), top: roof (dorsal), bottom: floor (ventral). (b) The spatial expression profile of Arx at E11.5. Red and green blocks denote substructures with high and low expression levels respectively. White blocks denote either non-existing substructures or missing data. (c) The number of expressed regions obtained from the quantized Arx expression data with varying threshold values. (d) The quantized Arx expression data with threshold 0.2384.
Figure 2
Figure 2. Functional enrichments of global expression states.
The enrichment outcome of each global expression state is displayed in one column. The top portion of a column denotes the binary global expression states over 7 time points (from E11.5 to P28). Blue and white patches indicate 1s and 0s. The remaining portion of the column denotes the enrichment p-values in selected GO categories. Each row denotes a GO category. Bright red patches indicate high formula image
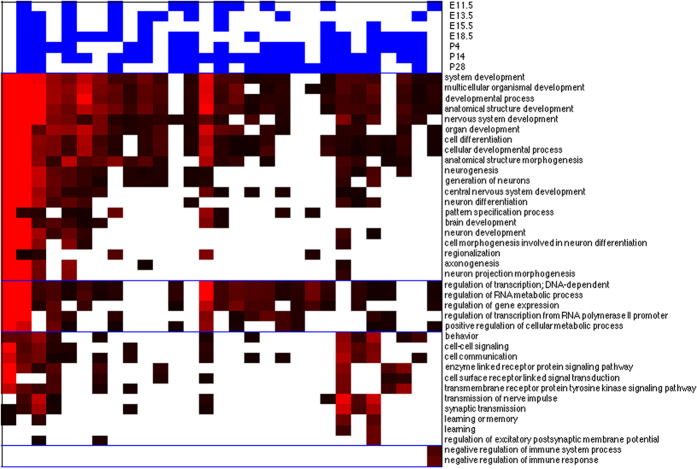
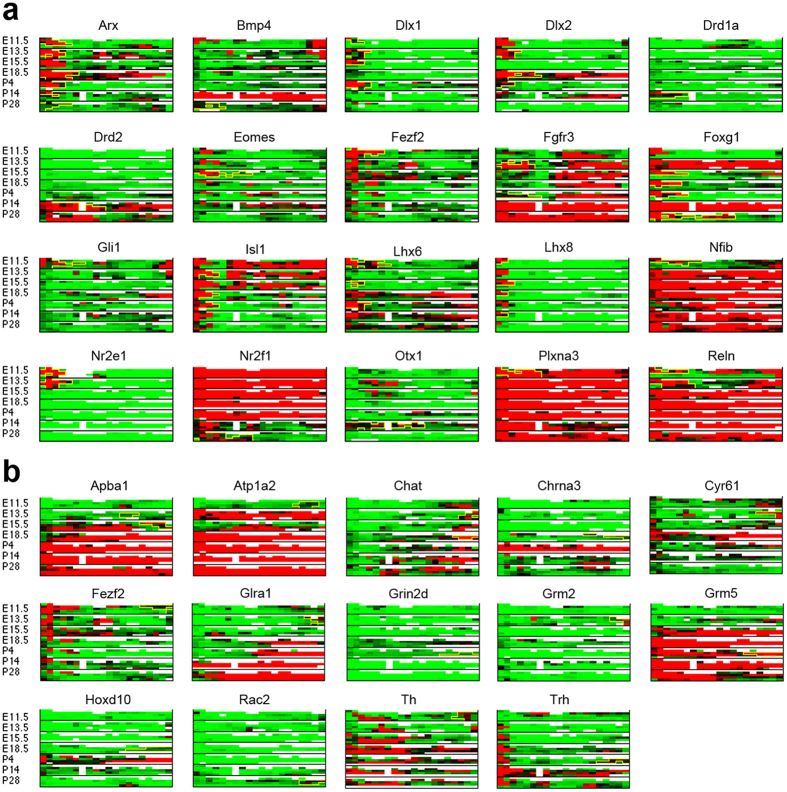
p-values, black patches indicate low formula image p-values, and white patches indicate enrichment p-values are not available. The GO categories are divided into four classes: developmental genes, transcription factors, neural information processing and immune response genes. The GO categories in these classes are separated by blue lines.
Figure 3
Figure 3. 45 recurrent local spatial expression patterns.
In each panel, the three numbers denote the index of the pattern, numbers of its occurrences among all (gene,time) combinations and among all genes. The top horizontal bar visualizes the relative frequencies of the pattern’s occurrence at 7 time points. Bright red pacthes and bright green patches represent the highest and lowest relative frequencies respectively. The spatial location and distribution of a pattern is visualized on a grid. The color in each substructure block represents the relative frequency where it is activated among the constituting expressed regions of a pattern. The color code follows the horizontal bars. The orientation of the grids conforms with Fig. 1a.
Figure 4
Figure 4. Functional enrichments of 6 spatial expression patterns in selected GO categories.
The spatial location and distribution of each pattern is again marked on a grid with an orientation rotated 90 degrees clockwise: top: anterior, bottom: posterior, right: dorsal, left: ventral. The color code of the pattern locations/distributions follows Fig. 3. The color code of enrichment p-values follows Fig. 2.
Figure 5
Figure 5. The spatial-temporal gene expression profiles show correlations with area-specific functions.
(a) The spatial-temporal expression profiles of genes possessing pattern 3 or 27 and involved in forebrain development. The spatial expression profiles at 7 time points are stacked vertically. The grid orientation and color code of expression levels follow Fig. 3. The boundaries of expressed regions belonging to pattern 3 or 27 in each gene are marked by yellow lines. (b) The spatial-temporal expression profiles of genes possessing patterns 2 or 45 and involved in locomotory behavior.
Figure 6
Figure 6. Temporal distributions of occurrences among the spatial expression patterns specific in the forebrain (blue), hindbrain (red), dorsal (cyan) and ventral (magenta) regions, as well as the background distribution of all patterns (black dashed line).
Figure 7
Figure 7. Genes co-expressed with Lhx2 are more likely to be affected by the deletion of Lhx2.
(a) Spatial-temporal expression profiles of Lhx2 in the ABA data. The grid orientation and color code follow Fig. 3. (b) Distributions of formula image 
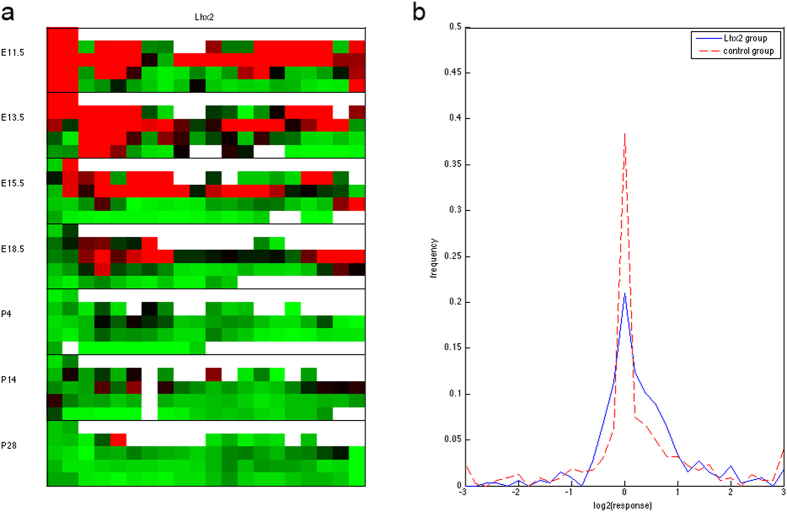
(forebrain tissue expression ratios) between the Lhx2 formula image mutant and the wildtype control among the gene groups possessing similar (blue solid line) and opposite (red dashed line) expression patterns of Lhx2 in the forebrain.

References

    1. Gao P., Sultan K. T., Zhang X. J. & Shi S. H. Lineage-dependent circuit assembly in the neocortex, Development 140, 2645–55 (2013). - PMC - PubMed
    1. Lein E. S. et al.. Genome-wide atlas of gene expression in the adult mouse brain. Nature 445, 168–176 (2007). - PubMed
    1. Thompson C. L. et al.. A high-resolution spatiotemporal atlas of gene expression of the developing mouse brain. Neuron 83, 309–323 (2014). - PMC - PubMed
    1. Miller J. A. et al.. Transcriptional landscape of the prenatal human brain. Nature 508, 199–207 (2014). - PMC - PubMed
    1. Hawrylycz M. J. et al.. An anatomically comprehensive atlas of the adult human brain transcriptome. Nature 489, 391–399 (2012). - PMC - PubMed

LinkOut - more resources