

Ecological opportunity and the evolution of habitat preferences in an arid-zone bird: implications for speciation in a climate-modified landscape
- PMID: 26787111
- PMCID: PMC4726247
- DOI: 10.1038/srep19613
Ecological opportunity and the evolution of habitat preferences in an arid-zone bird: implications for speciation in a climate-modified landscape
Abstract
Bioclimatic models are widely used to investigate the impacts of climate change on species distributions. Range shifts are expected to occur as species track their current climate niche yet the potential for exploitation of new ecological opportunities that may arise as ecosystems and communities remodel is rarely considered. Here we show that grasswrens of the Amytornis textilis-modestus complex responded to new ecological opportunities in Australia's arid biome through shifts in habitat preference following the development of chenopod shrublands during the late Plio-Pleistocene. We find evidence of spatially explicit responses to climatically driven landscape changes including changes in niche width and patterns of population growth. Conservation of structural and functional aspects of the ancestral niche appear to have facilitated recent habitat shifts, while demographic responses to late Pleistocene climate change provide evidence for the greater resilience of populations inhabiting the recently evolved chenopod shrubland communities. Similar responses could occur under future climate change in species exposed to novel ecological conditions, or those already occupying spatially heterogeneous landscapes. Mechanistic models that consider structural and functional aspects of the niche along with regional hydro-dynamics may be better predictors of future climate responses in Australia's arid biome than bioclimatic models alone.
Figures
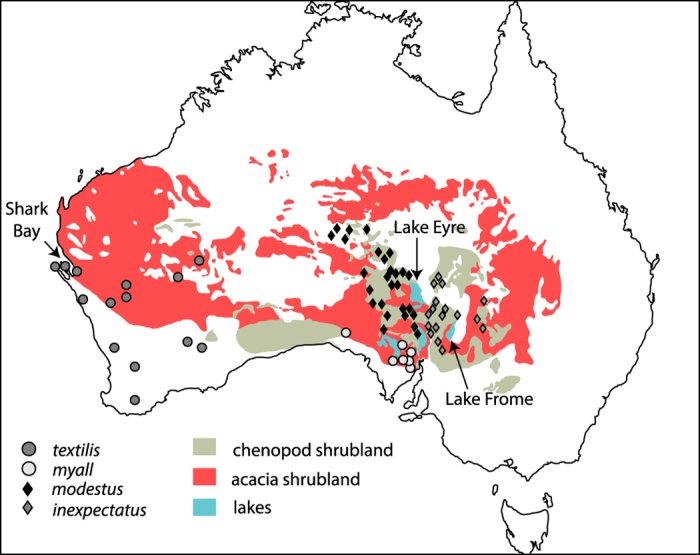
 ) occurred in a wide range of shrubland habitats, most commonly acacia or eucalypt shrublands communities, but is now restricted to the far north-west of its range near Shark Bay. The eastern subspecies (A. t. myall,
  ) is most commonly associated with dense chenopod shrubland (CS) in the southernmost sector of the Lake Eyre Basin. The Thick-billed Grasswren (A. modestus) inhabits dense CS of central Australia with the subspecies modestus (
 ) occupying drainages to the west of Lake Eyre, and inexpectatus (
 ) drainages to the east. Sample locations for the ATM complex ND2 sequences adapted from. Vegetation map prepared by JN using Adobe Illustrator CS6 software and adapted from Journal of Arid Environments 75, S. R. Morton et al., A fresh framework for the ecology of arid Australia, 313–329, 2011, with permissions from Elsevier.

 ) and commenced at 6.1 Ma before present. Bayesian posterior probability for this node was 0.95. Recent speciation events are clustered during the period 0.2–2 Ma as indicated by the dashed line and indicate the likely time period for the formation of contemporary CS communities. * denotes the species Maireana pyramidata a dominant species in the CS communities occupied by the ATM complex.
 ) and are dated to 4.55 (Clade 1) and 2.52 Ma (Clade 2) before present. Bayesian posterior probabilities for these nodes were 0.95 and 0.98 respectively. * denotes the species Atriplex nummularia a dominant species in the CS communities occupied by the ATM complex.

References
-
- VanDerWal J. et al. Focus on poleward shifts in species’ distribution underestimates the fingerprint of climate change. Nature Clim. Change 3, 239–243 (2012).
-
- Thomas C. D. et al. Extinction risk from climate change. Nature 427, 145–148 (2004). - PubMed
-
- Hoffman A. A. & Sgrò C. M. Climate change and evolutionary adaptation. Nature 470, 479–485 (2011). - PubMed
MeSH terms
LinkOut - more resources
Full Text Sources
Other Literature Sources
