. 2016 Jan 19:16:2.
doi: 10.1186/s12861-016-0102-4.

Revisiting in vivo staining with alizarin red S--a valuable approach to analyse zebrafish skeletal mineralization during development and regeneration

Affiliations

Revisiting in vivo staining with alizarin red S--a valuable approach to analyse zebrafish skeletal mineralization during development and regeneration

A Bensimon-Brito et al. BMC Dev Biol. .

Abstract

Background: The correct evaluation of mineralization is fundamental for the study of skeletal development, maintenance, and regeneration. Current methods to visualize mineralized tissue in zebrafish rely on: 1) fixed specimens; 2) radiographic and μCT techniques, that are ultimately limited in resolution; or 3) vital stains with fluorochromes that are indistinguishable from the signal of green fluorescent protein (GFP)-labelled cells. Alizarin compounds, either in the form of alizarin red S (ARS) or alizarin complexone (ALC), have long been used to stain the mineralized skeleton in fixed specimens from all vertebrate groups. Recent works have used ARS vital staining in zebrafish and medaka, yet not based on consistent protocols. There is a fundamental concern on whether ARS vital staining, achieved by adding ARS to the water, can affect bone formation in juvenile and adult zebrafish, as ARS has been shown to inhibit skeletal growth and mineralization in mammals.

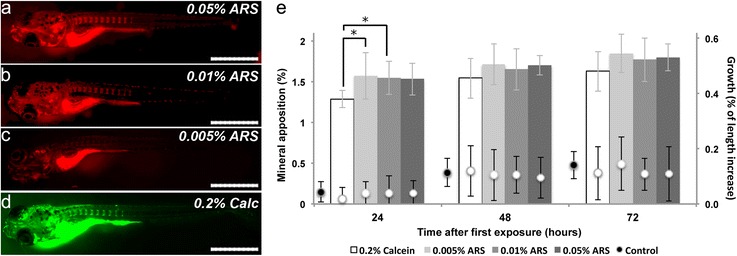
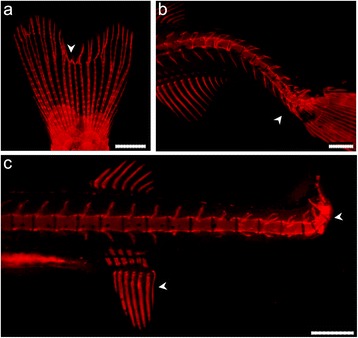
Results: Here we present a protocol for vital staining of mineralized structures in zebrafish with a low ARS concentration that does not affect bone mineralization, even after repetitive ARS staining events, as confirmed by careful imaging under fluorescent light. Early and late stages of bone development are equally unaffected by this vital staining protocol. From all tested concentrations, 0.01% ARS yielded correct detection of bone calcium deposits without inducing additional stress to fish.

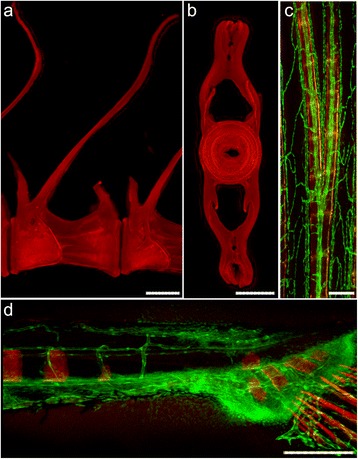
Conclusions: The proposed ARS vital staining protocol can be combined with GFP fluorescence associated with skeletal tissues and thus represents a powerful tool for in vivo monitoring of mineralized structures. We provide examples from wild type and transgenic GFP-expressing zebrafish, for endoskeletal development and dermal fin ray regeneration.


Figures

Fig. 1
Fig. 1
Quantification of mineral apposition in developing zebrafish larvae. Schematic representation of the quantification of the mineral apposition rates in vertebral centra following ARS or calcein staining. a Mineral apposition was determined (at 24, 48 and 72 h post-staining - hps) by monitoring the mineralized surface areas (SA’s) of the three least mineralized vertebral centra (grey) in the beginning of the experiment. b Centra SA’s were calculated based on width (C.Wi) and height (C.Hi), as indicated
Fig. 2
Fig. 2
Determination of the proper ARS concentration for vital staining. Imaging of 6 dpf stained larvae with the same settings showed that (a) 0.05 % ARS 15 min immersion yielded stronger staining than (b) 0.01 % ARS, but the later provided the best signal to noise ratio, with minimum stress levels. c 0.005 % ARS was considered the lowest concentration providing signal detection, since most structures were weakly stained. d 0.2 % calcein staining was used as a reference staining. e Graphical representation of mineral apposition rates (columns) at 24, 48 and 72 h after first staining, when exposed to 0.005, 0.01 and 0.05 % ARS and 0.2 % calcein. Bars represent standard deviation. Means were statistically different (*p < 0.05), by multiple comparison of means using one-way ANOVA and Tukey’s post test, between larvae stained with calcein and those stained with 0.005 % (0.29 % less apposition rate with calcein, 82 % of the 0.005 % ARS value) and 0.01 % (0.26 % less mineral apposition rate with calcein, 83 % of the 0.01 % ARS value) ARS at 24 hps. On the second axis of the graph, growth (inferred by increase in TL) is indicated: control conditions (black dots; n = 17); following staining with 0.005, 0.01 and 0.05 % ARS, and 0.2 % calcein (white dots; n = 17). Scale bars = 1 mm
Fig. 3
Fig. 3
Sequence of lepidotrichia regeneration events in the zebrafish caudal fin. Caudal fin of fish stained with 0.01 % ARS at a 24, b 48, c 72 and d 96 hpa. b’ Detail of a fin ray at 48 hpa, already displaying de novo mineralized tissue. Amputation axis is indicated (dashed line). Scale bar (a-d) = 2 mm; (b’) = 0.2 mm
Fig. 4
Fig. 4
ARS staining of fixed zebrafish samples. Panels a-b show a vertebral column of a 10 dpf larva stained with 0.01 % ARS in 70 % ethanol. a Bright field observation provides less detail of the early mineralization deposits than b fluorescence observation (arrowheads). Panels c-d show cranial structures of a juvenile (30 dpf, 8 mm TL) stained with 0.01 % ARS and observed under c bright field and d fluorescent light, evidencing the higher power of detection of, e.g., the operculum (arrowheads) under fluorescent conditions. Scale bars (a, b) = 0.04 mm; (c, d) = 0.2 mm
Fig. 5
Fig. 5
ARS fluorescence sensitivity single or in combination with expression of green fluorescent reporters. Macerated abdominal vertebrae of adult fish in a sagittal view and b transverse view show distinct mineralization fronts, indicative of vertebral growth. c Caudal fin ray of an adult Tg(fli1:eGFP) fish stained with 0.01 % ARS and d caudal vertebrae formation in a Tg(fli1:eGFP) zebrafish larva. There is a clear distinction between structures stained with ARS and structures that express GFP. Scale bars (a, b) = 0.1 mm; (c, d) = 0.2 mm
Fig 6
Fig 6
Detection of skeletal malformations in zebrafish. Deformed bony structures in a caudal fin rays and b-c different regions of the vertebral column. All regions display affected structures with different degrees of severity. White arrowheads show sites of malformation. Scale bars (a) = 2 mm; (b-c) = 0.4 mm

References

    1. Bruneel B, Witten PE. Power and challenges of using zebrafish as a model for skeletal tissue imaging. Connect Tissue Res. 2015;56(2):161–173. doi: 10.3109/03008207.2015.1013193. - DOI - PubMed
    1. Apschner A, Schulte-Merker S, Witten PE. Chapter 10 - Not all bones are created equal – Using zebrafish and other teleost species in osteogenesis research. In: William H, Detrich I, Westerfield M, Zon LI, editors. Methods in Cell Biology. 3. USA: Academic; 2011. pp. 239–255. - PubMed
    1. Westerfield M. The zebrafish book. A guide for the laboratory use of zebrafish (Danio rerio) 4. Eugene: University of Oregon Press; 2000.
    1. Driever W, Solnica-Krezel L, Schier AF, Neuhauss SC, Malicki J, Stemple DL, et al. A genetic screen for mutations affecting embryogenesis in zebrafish. Development. 1996;123:37–46. - PubMed
    1. Haffter P, Granato M, Brand M, Mullins MC, Hammerschmidt M, Kane DA, et al. The identification of genes with unique and essential functions in the development of the zebrafish, Danio rerio. Development. 1996;123:1–36. - PubMed

Publication types

LinkOut - more resources