

Clinical Features, Virus Identification, and Sinusitis as a Complication of Upper Respiratory Tract Illness in Children Ages 4-7 Years
- PMID: 26787374
- PMCID: PMC4808614
- DOI: 10.1016/j.jpeds.2015.12.034
Clinical Features, Virus Identification, and Sinusitis as a Complication of Upper Respiratory Tract Illness in Children Ages 4-7 Years
Abstract
Objective: To determine the rate of sinusitis complicating upper respiratory tract illnesses (URIs) in children. We prospectively identified the clinical, virologic, and epidemiologic characteristics of URIs in a population of 4- to 7-year-old children followed for 1 year.
Study design: This was an observational cohort study in 2 primary care pediatric practices in Madison, Wisconsin. Nasal samples were obtained during 4 asymptomatic surveillance visits and during symptomatic URIs. A polymerase chain reaction-based assay for 9 respiratory viruses was performed on nasal samples. A diagnosis of sinusitis was based on published criteria.
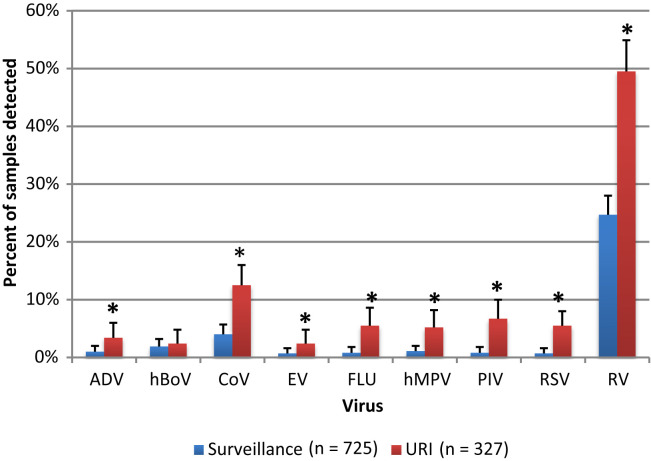
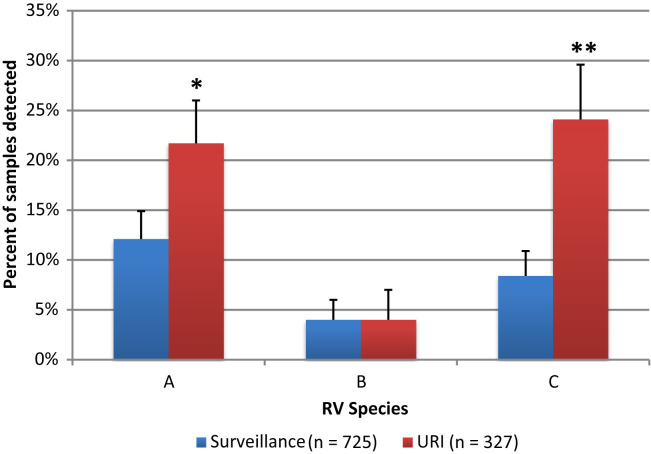
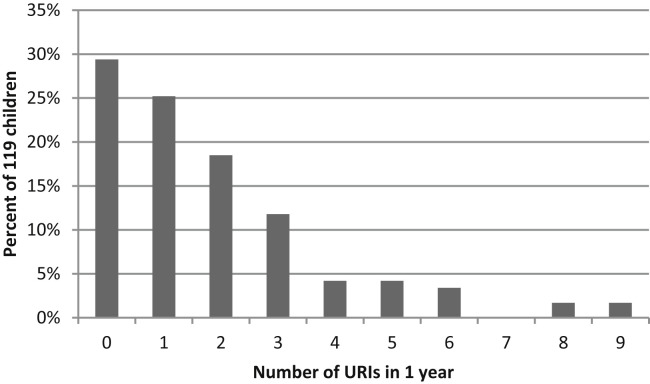
Results: Two hundred thirty-six children ages 48-96 months were enrolled. A total of 327 URIs were characterized. The mean number of URIs per child was 1.3 (range 0-9) per year. Viruses were detected in 81% of URIs; rhinovirus (RV) was most common. Seventy-two percent of URIs were resolved clinically by the 10th day. RV-A and RV-C were detected more frequently at URI visits; RV-B was detected at the same rate for both asymptomatic surveillance visits and URI visits. Sinusitis was diagnosed in 8.8% of symptomatic URIs. Viruses were detected frequently (33%) in samples from asymptomatic children.
Conclusions: Sinusitis occurred in 8.8% of symptomatic URIs in our study. The virus most frequently detected with URIs in children was RV; RV-A and RV-C detection but not RV-B detection were associated with illness. Viruses, especially RV, are detected frequently in asymptomatic children. Most URIs have improved or resolved by the 10th day after onset. Children experienced a mean of 1.3 URIs per year, which was lower than expected.
Copyright © 2016 Elsevier Inc. All rights reserved.
Figures
References
-
- Fendrick A.M., Monto A.S., Nightengale B., Sarnes M. The economic burden of non-influenza-related viral respiratory tract infection in the United States. Arch Intern Med. 2003;163:487–494. - PubMed
-
- Gwaltney J.M., Jr., Hendley J.O., Simon G., Jordan W.S., Jr. Rhinovirus infections in an industrial population. II. Characteristics of illness and antibody response. JAMA. 1967;202:494–500. - PubMed
Publication types
MeSH terms
Grants and funding
LinkOut - more resources
Full Text Sources
Other Literature Sources
Medical
