. 2016 Feb 2;113(5):1156-61.
doi: 10.1073/pnas.1524999113. Epub 2016 Jan 19.

Multiscale model of light harvesting by photosystem II in plants

Affiliations

Multiscale model of light harvesting by photosystem II in plants

Kapil Amarnath et al. Proc Natl Acad Sci U S A. .

Abstract

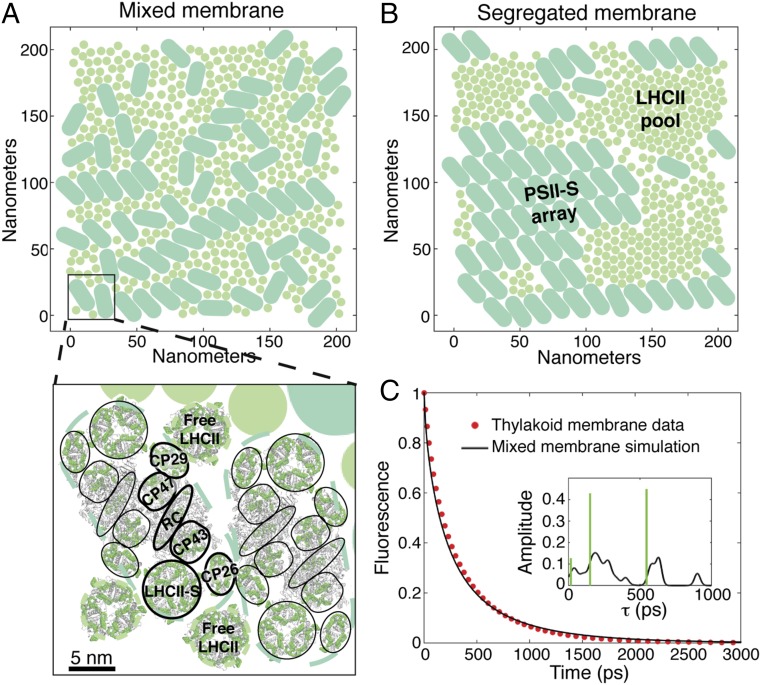
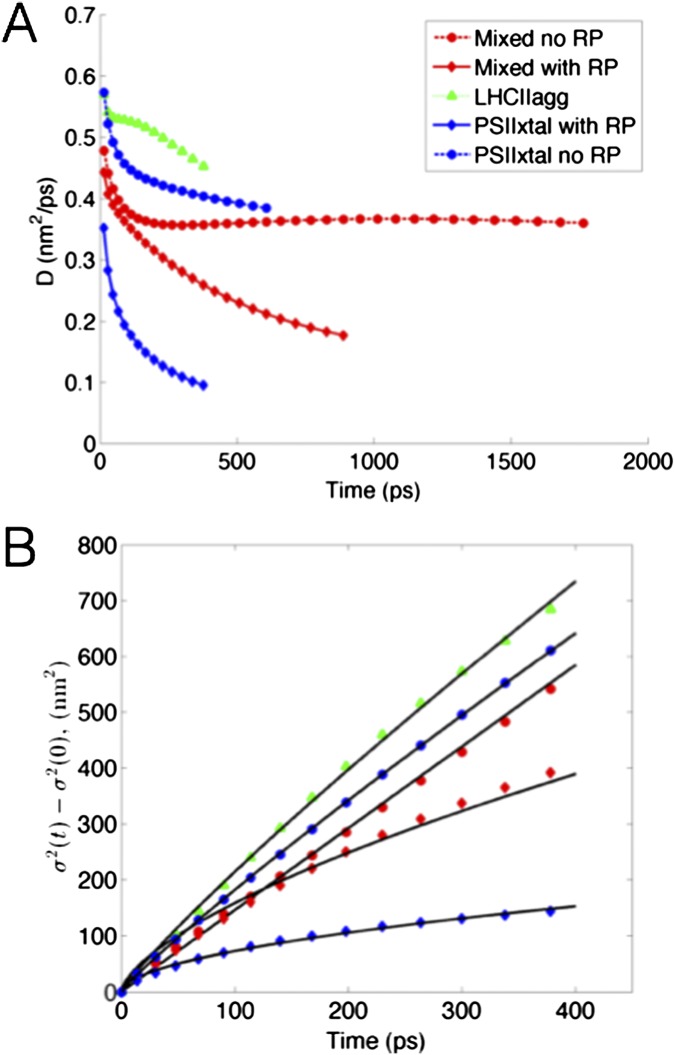
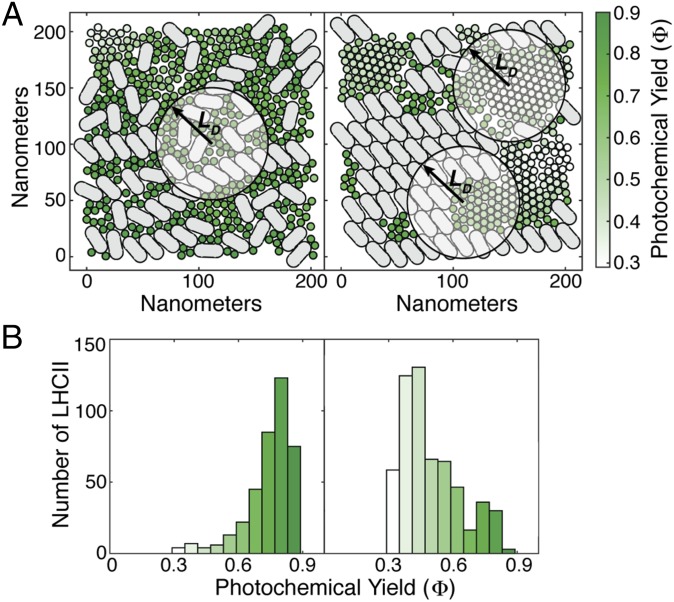
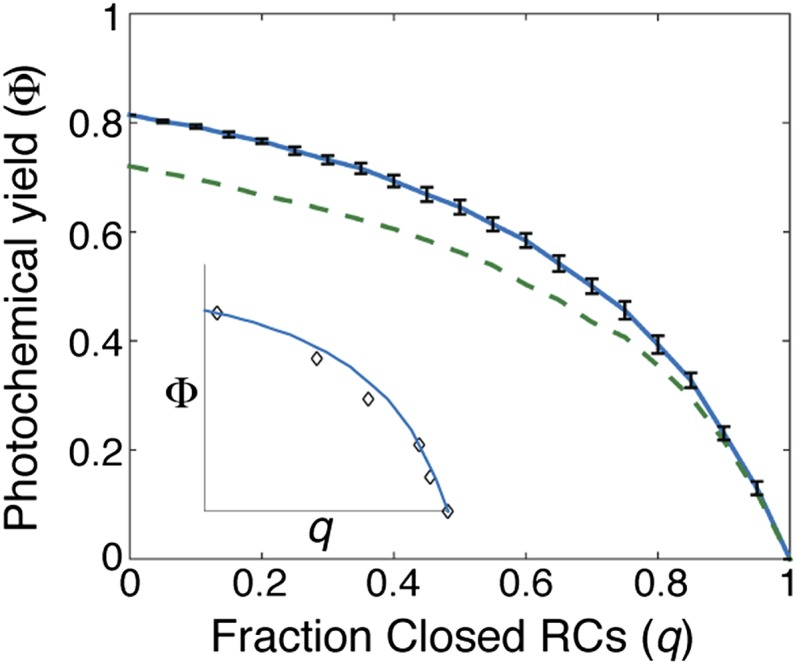
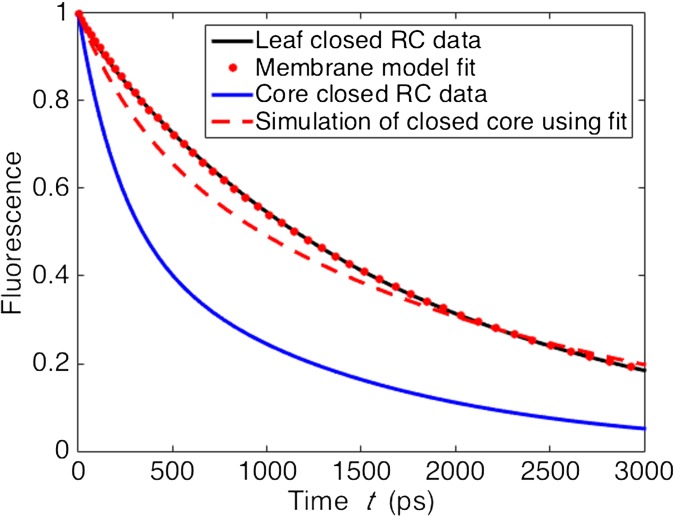
The first step of photosynthesis in plants is the absorption of sunlight by pigments in the antenna complexes of photosystem II (PSII), followed by transfer of the nascent excitation energy to the reaction centers, where long-term storage as chemical energy is initiated. Quantum mechanical mechanisms must be invoked to explain the transport of excitation within individual antenna. However, it is unclear how these mechanisms influence transfer across assemblies of antenna and thus the photochemical yield at reaction centers in the functional thylakoid membrane. Here, we model light harvesting at the several-hundred-nanometer scale of the PSII membrane, while preserving the dominant quantum effects previously observed in individual complexes. We show that excitation moves diffusively through the antenna with a diffusion length of 50 nm until it reaches a reaction center, where charge separation serves as an energetic trap. The diffusion length is a single parameter that incorporates the enhancing effect of excited state delocalization on individual rates of energy transfer as well as the complex kinetics that arise due to energy transfer and loss by decay to the ground state. The diffusion length determines PSII's high quantum efficiency in ideal conditions, as well as how it is altered by the membrane morphology and the closure of reaction centers. We anticipate that the model will be useful in resolving the nonphotochemical quenching mechanisms that PSII employs in conditions of high light stress.

Keywords: excitation energy transfer; fluorescence lifetime; photosynthesis; quantum coherence; structure−function relationships.


Conflict of interest statement

The authors declare no conflict of interest.

Figures

Fig. 1.
Fig. 1.
Accurate simulation of chlorophyll fluorescence dynamics from thylakoid membranes using structure-based modeling of energy transfer in PSII. (A and B) The representative mixed (A) and segregated (B) membrane morphologies generated using Monte Carlo simulations and used throughout this work. PSII-S are indicated by the light teal pills, and LHCII, which are trimeric complexes, are indicated by the light grey-green circles. The segregated membrane forms PSII-S arrays and LHCII pools. As shown schematically in A (Bottom) existing crystal structures of PSII-S (14) and LHCII (24) were overlaid on these membrane patches to establish the locations of all chlorophyll pigments. The light teal and light grey-green dashed lines outline the excluded area associated with PSII-S and LHCII trimers respectively, in the Monte Carlo simulations. The chlorophyll pigments are indicated in green, and the protein is depicted by the grey cartoon ribbon. PSII-S is a twofold symmetric dimer of pigment−protein complexes that are outlined by black lines. LHCII-S (strongly bound LHCII), CP26, CP29, CP43, and CP47 are antenna proteins, and RC indicates the reaction center. The inhomogeneously averaged rates of energy transfer between strongly coupled clusters of pigments were calculated using generalized Förster theory. (C) Simulated fluorescence decay of the mixed membrane (solid black line) and the PSII component of experimental fluorescence decay data from thylakoid membranes from ref. (red, dotted line). Inset shows the lifetime components and amplitudes of the simulated decay as calculated using our model with a Gaussian convolution (σ = 20 ps) (black line) or by fitting to three exponential decays (green bars).
Fig. S1.
Fig. S1.
Overlay of pigment locations on the shapes used for the Monte Carlo simulations. (A) The chlorophyll pigments of LHCII (green circles) and PSII (teal discorectangle) are indicated by the red squares in this zoom in of a section of a simulated thylakoid membrane. (B) Fluorescence decays of the mixed membrane with energy transfer rates greater than 2 ps−1, 5 ps−1, 10 ps−1, or 100 ps−1 set equal to zero. Also indicated is the fluorescence decay of the mixed membrane with all rates included in the rate matrix.
Fig. S2.
Fig. S2.
Effects of averaging energy transfer rates over inhomogeneous realizations on fluorescence decay of a PSII-S (C2S2 supercomplex). Comparison between the fluorescence decay of the rate matrix averaged over inhomogeneous realizations, Fl(t)K (blue), and the average of the fluorescence decays of many inhomogeneous realizations of K, Fl(t) (red), for the C2S2 supercomplex.
Fig. 2.
Fig. 2.
Excitation transport in grana membranes. Simulation of excitation movement in the five grana membrane configurations shown in the legend: mixed membrane with and without the RP states in the reaction center, PSII-S array with and without the RP states, and LHCII pool. In each case, excitation was initiated on a single pigment−protein complex. (A) The change in the spread of excitation over time. The diffusion exponent (Eq. 1) is shown on the right of the plot. (B) Fraction of surviving excitation as a function of net displacement L from the initial starting point. The dashed line, where the fraction of surviving excitation is 1/e, demarcates the excitation diffusion length (LD). The dimensions of some of the configurations were too small to calculate an LD, so linear extrapolation was used to approximate it (line segments that do not include markers). Using the same extrapolation, the fraction of surviving excitation goes to 0 when L is ∼70 nm for the LHCII pool.
Fig. S3.
Fig. S3.
Additional plots of simulated diffusion of excitation. (A) Diffusivity D plotted against time for the five types of regions in the membrane (Eq. 1). (B) Plots of the fits of the equation σ2(t)σ2(0)=Atα, in which A and α were fit parameters, to diffusion dynamics in each of the five membrane regions.
Fig. 3.
Fig. 3.
The diffusion length in the antenna determines the effect of grana membrane morphology on photochemical yield. (A) Excitation was initiated at each LHCII in both the mixed (Left) and segregated (Right) morphologies. The color of the LHCII indicates the fraction of excitation that results in productive photochemistry (Φ; see colorbar on far right) as simulated with our model. The circles with radius LD indicate the area of the membrane accessible to excitation initiated at the center of the circle. (B) Histograms representing the distribution of Φ for the mixed (Left) and segregated (Right) membranes using the coloration from A.
Fig. 4.
Fig. 4.
Simulation of the effect of closing reaction centers on photochemical yield. The solid blue line indicates the mixed membrane and the dashed green line the segregated membrane. Each calculated photochemical yield (Φ) along the membrane curve represents an average over different configurations of closed RCs. The standard deviation of each distribution along the mixed membrane is represented by black bars. (Inset) Comparison of the mixed membrane simulation with data (open black diamonds) from ref. , as reproduced in ref. .
Fig. S4.
Fig. S4.
Fit of closed RC model to closed RC fluorescence lifetime data from leaves, with closed RC core data and simulation using fit. The blue line indicates the PSII contribution to the fluorescence decay measured on dark-adapted wild-type leaves of Arabidopsis thaliana with closed reaction centers (42). The dotted red line indicates the fit of the closed RC model using either the mixed or segregated membrane. See Electron transfer model for details of procedure. The blue line indicates fluorescence decay data from PSII cores with closed reaction centers (46). The dashed red line is the simulation of closed PSII core fluorescence with the electron transfer parameters from the membrane fit. See SI Results and Discussion for a brief discussion of all four curves.

References

    1. Blankenship RE. Molecular Mechanisms of Photosynthesis. 2nd Ed Blackwell Sci; Malden, MA: 2014.
    1. Baker NR. Chlorophyll fluorescence: A probe of photosynthesis in vivo. Annu Rev Plant Biol. 2008;59:89–113. - PubMed
    1. Ruban AV, Johnson MP, Duffy CDP. The photoprotective molecular switch in the photosystem II antenna. Biochim Biophys Acta. 2012;1817(1):167–181. - PubMed
    1. Külheim C, Ågren J, Jansson S. Rapid regulation of light harvesting and plant fitness in the field. Science. 2002;297(5578):91–93. - PubMed
    1. Ort DR, et al. Redesigning photosynthesis to sustainably meet global food and bioenergy demand. Proc Natl Acad Sci USA. 2015;112(28):8529–8536. - PMC - PubMed

Publication types

Substances