. 2016 Mar 1;33(5):439-59.
doi: 10.1089/neu.2015.3956. Epub 2016 Jan 20.

A Unilateral Cervical Spinal Cord Contusion Injury Model in Non-Human Primates (Macaca mulatta)

Affiliations

A Unilateral Cervical Spinal Cord Contusion Injury Model in Non-Human Primates (Macaca mulatta)

Ernesto A Salegio et al. J Neurotrauma. .

Abstract

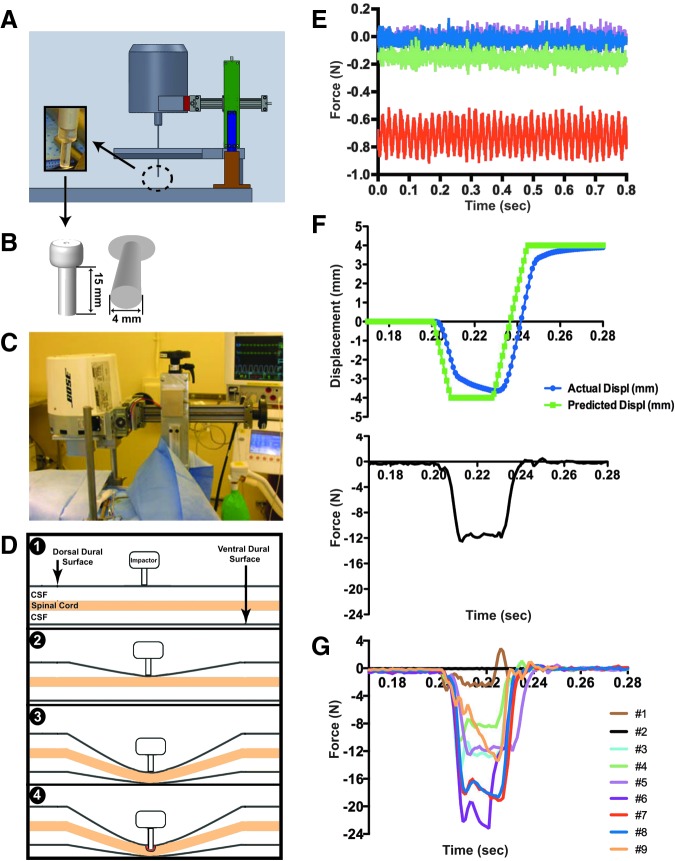
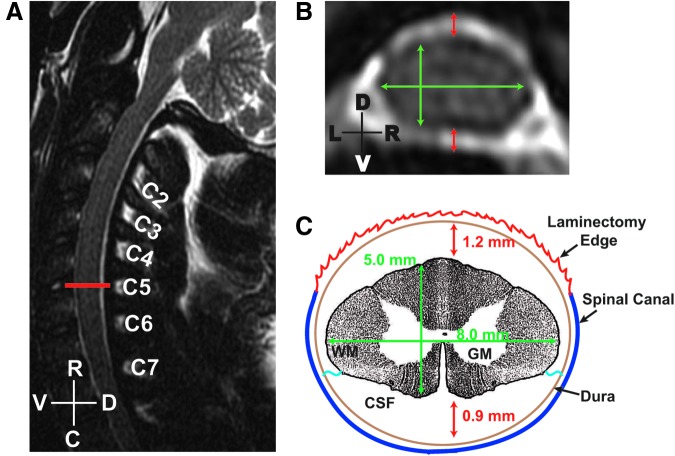
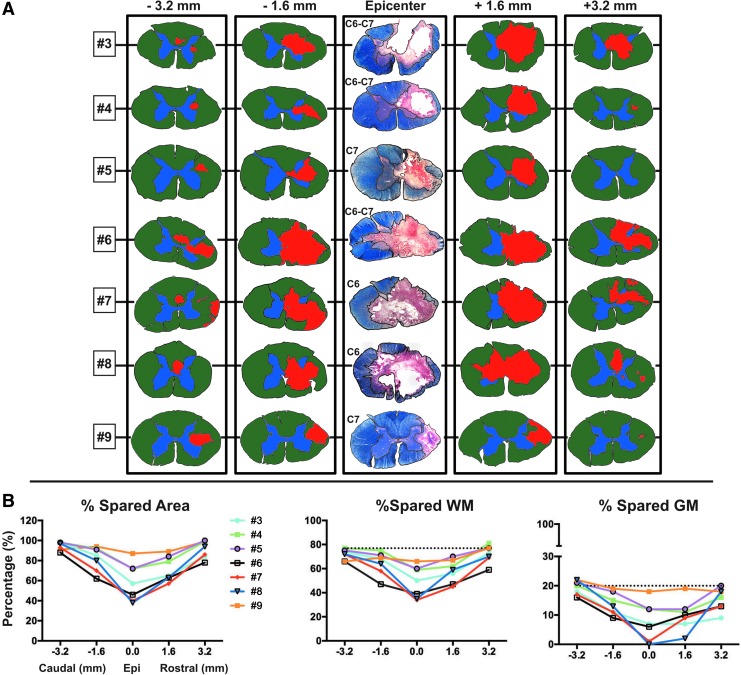
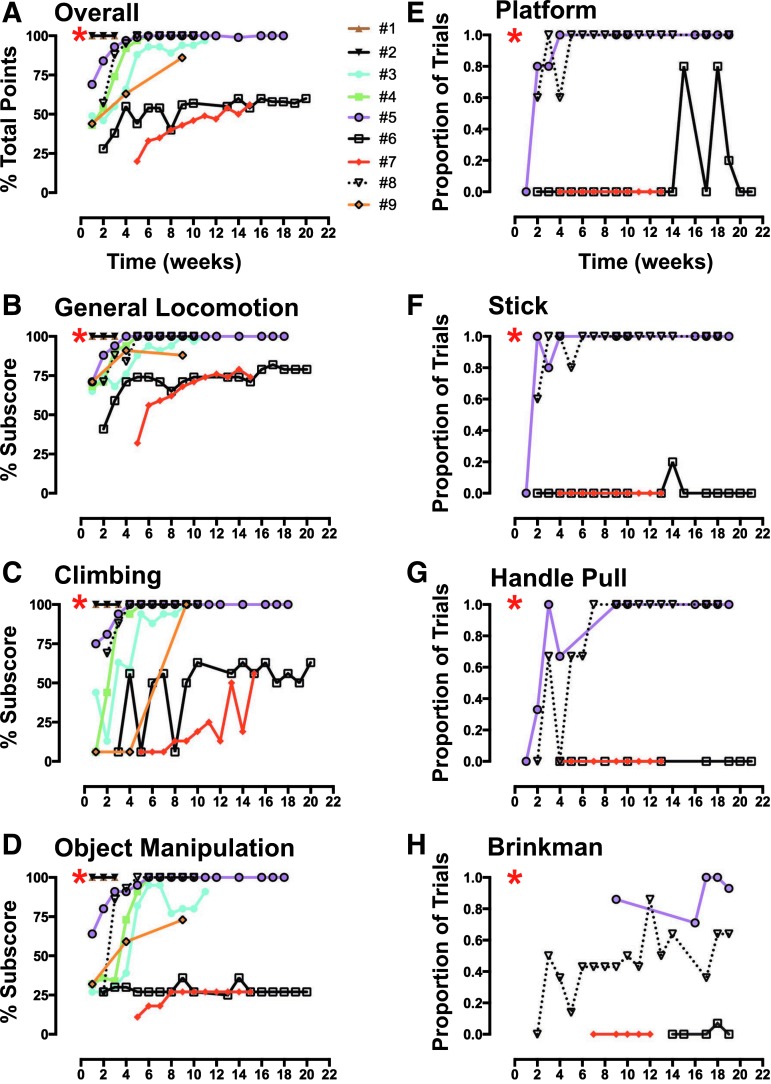
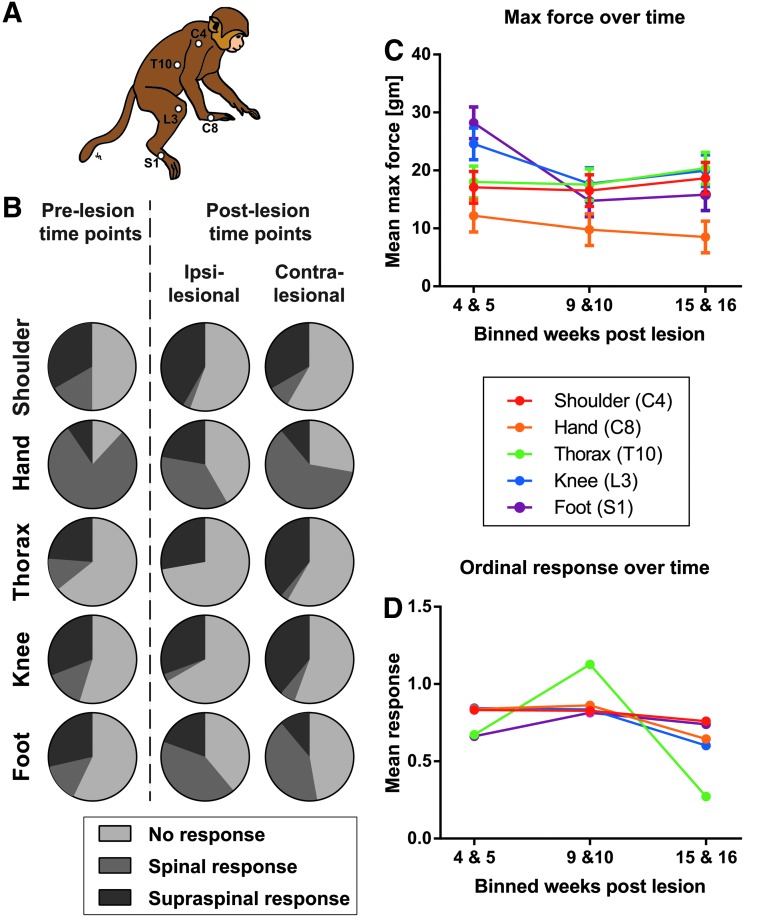
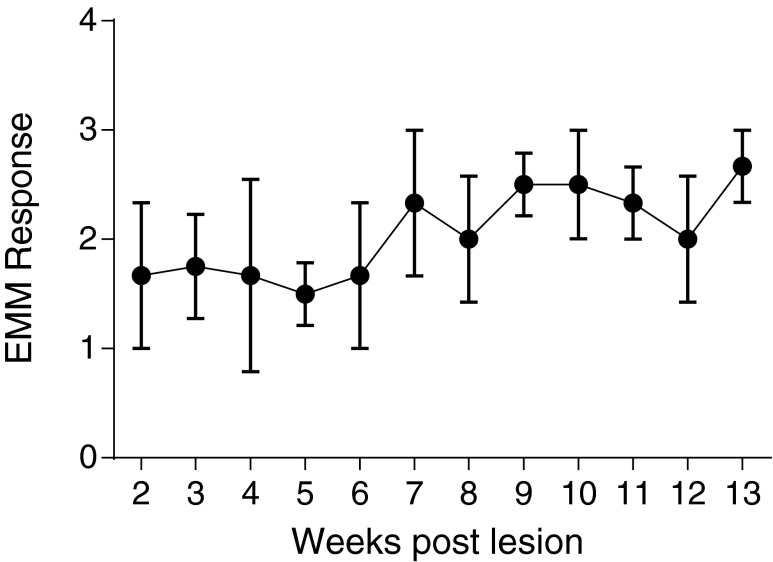
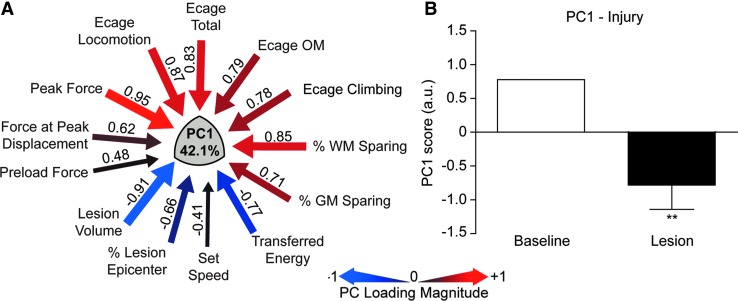
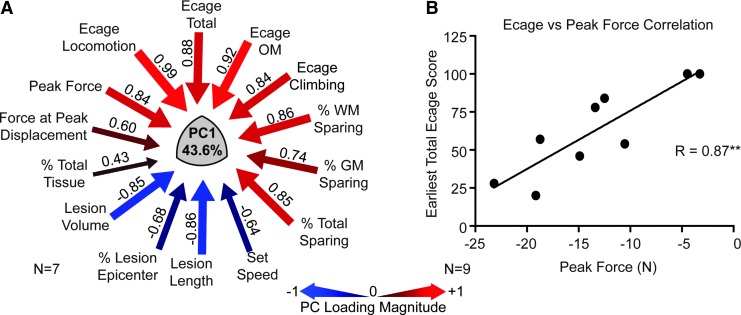
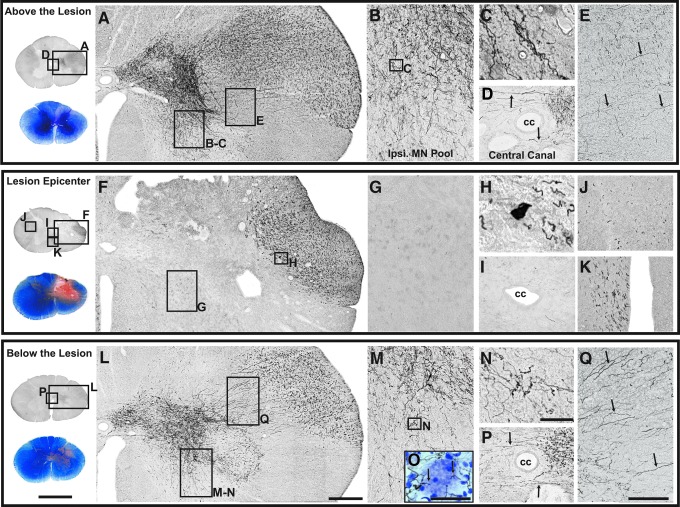
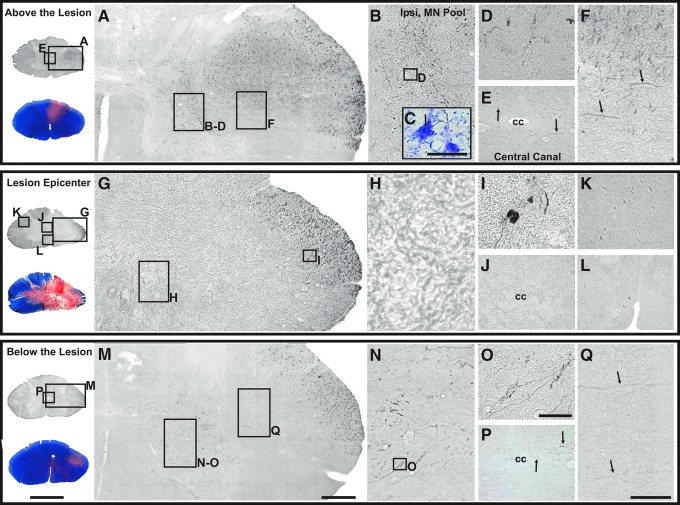
The development of a non-human primate (NHP) model of spinal cord injury (SCI) based on mechanical and computational modeling is described. We scaled up from a rodent model to a larger primate model using a highly controllable, friction-free, electronically-driven actuator to generate unilateral C6-C7 spinal cord injuries. Graded contusion lesions with varying degrees of functional recovery, depending upon pre-set impact parameters, were produced in nine NHPs. Protocols and pre-operative magnetic resonance imaging (MRI) were used to optimize the predictability of outcomes by matching impact protocols to the size of each animal's spinal canal, cord, and cerebrospinal fluid space. Post-operative MRI confirmed lesion placement and provided information on lesion volume and spread for comparison with histological measures. We evaluated the relationships between impact parameters, lesion measures, and behavioral outcomes, and confirmed that these relationships were consistent with our previous studies in the rat. In addition to providing multiple univariate outcome measures, we also developed an integrated outcome metric describing the multivariate cervical SCI syndrome. Impacts at the higher ranges of peak force produced highly lateralized and enduring deficits in multiple measures of forelimb and hand function, while lower energy impacts produced early weakness followed by substantial recovery but enduring deficits in fine digital control (e.g., pincer grasp). This model provides a clinically relevant system in which to evaluate the safety and, potentially, the efficacy of candidate translational therapies.

Keywords: biomechanics of injury; contusion; functional recovery; primate; spinal cord injury.


Figures

<b>FIG. 1.</b>
FIG. 1.
The contusion device, its use and the resulting force readout for all impacts. A computer-aided design illustration of the actuator on the stereotaxic frame and spinal unit (A), including the dimensions of the polycarbonate impactor tip (B) and in vivo setup during surgery (C). Measures taken to stabilize the spinal cord prior to initiating impact are graphically illustrated (D, steps 1-4) to demonstrate initial contact of impactor tip with the dural surface followed by gradual displacement of the cerebrospinal fluid (CSF) until the cord is stabilized against the ventral aspect of the canal. A deflection in force from the compensated load readout (E) indicates the spatial location of the dura (D1), the spinal cord surface (D2) and the spinal cord contact with the bony canal (D3-D4). Sample readouts during surrogate testing are shown (E) to demonstrate differences in force readouts over time at each step starting with the impactor tip alone with no contact (pink trace), initial contact of impactor tip with dural surface (blue trace), displacement of the CSF and contact with the spinal cord (green trace), and displacement of CSF under the spinal cord with entrapment against the floor of the vertebral canal (red trace). Biomechanical parameters such as actual displacement (F, blue trace) and peak force over time (F, black trace lower graph) are available immediately after impact; these traces are from subject #5. Actual force traces for all subjects are shown in G (see text for details).
<b>FIG. 2.</b>
FIG. 2.
Pre-operative magnetic resonance images used to generate measurements of the spinal cord parenchyma and cerebrospinal fluid (CSF) space. Sagittal (A) and axial (B) T2-weighted images acquired on a 1.5T scanner indicate the location of the fifth cervical vertebral level (A, red line) and were used to estimate size of the spinal cord (B, green lines) and amount CSF space (A, red lines) at that level. Based on these approximations, a schematic representation for the region of interest was generated (C). In this example, measurements of spinal cord (5 × 8 mm) and CSF spaces 1.2 mm above and 0.9 mm below the spinal cord) are shown, as well as a representation of the projected laminectomy, the vertebral canal, and the denticulate ligaments (blue wavy lines). R-C, rostral-caudal axis; D-V, dorsal-ventral axis; L-R, left-right side; W/GM, white/gray matter.
<b>FIG. 3.</b>
FIG. 3.
Post-lesion T2-weighted magnetic resonance images of the spinal cord used to identify the lesion area. Animals were imaged on a 1.5T scanner (subjects #5, 6, and 8) or on a 3T scanner (subject #9). Single magnetic resonance imaging (MRI) slices in the sagittal and axial plane demonstrate the region of hyperintensive T2-signal indicative of the lesion (red arrows). For comparison, the lesion epicenters identified in the histological sections (stained with eriochrome cyanine and neutral red) also are shown. The MRIs were performed at 14 or 17 weeks after injury, and sacrifice was at 19, 20, or 21 weeks after injury (Table 4). The larger lesion size in the histological sections is noteworthy and may reflect the high density of cellular elements in the lesion site as reflected by the neutral red staining, whereas, hyperintensive T2-signal from the magnetic resonance images was limited to the fluid filled cavities, and these were not so clearly evident in the histological sections.
<b>FIG. 4.</b>
FIG. 4.
Histological section analysis of the rostral-caudal spread of the lesions shows that the more severe lesions extend for considerable distances in the spinal cord and affect both white matter (WM) and gray matter (GM) areas. (A) Histological sections processed for eriochrome cyanine and neutral red were used to reconstruct the spread of the lesion, and are shown for all injured subjects at the lesion epicenter and at 1.6 and 3.2 mm rostral and caudal. For measurement purposes, sections at the aforementioned intervals were drawn and color-coded in Adobe Photoshop (gray matter = blue; white matter = green; lesion area = red). The graphs in (B) show quantification of the total lesion area at all intervals. Total gray and white matter sparing, as well as total spared area, are represented as a proportion of the entire cross-sectional area of the spinal cord, and the dotted lines represent the percent of gray and white matter in an uninjured cord section.
<b>FIG. 5.</b>
FIG. 5.
Heat map of the correlational matrix showing the linear relationship of all biomechanical measures with all histological and behavioral outcome measures. Peak force and force at peak displacement correlate well with nearly all of the biomechanical, histological measures, and behavioral outcomes as indicated by the brightness of the blue and red boxes across all comparisons. Positive correlations are indicated as red and negative as blue, whereas the purity of the color is determined by the strength of the correlation (rho). Boxes on the left and lower portion of the matrix show the scatter plots of all the data. The diagonal boxes where each variable intersects itself, contains a graphical representation of the data distribution; most are normally distributed but some are clearly skewed. Boxes on the upper and right side show the specific correlation.
<b>FIG. 6.</b>
FIG. 6.
Behavioral recovery during open field and chair testing shows that subjects exhibit a range of deficits early after injury that recover in some animals but persist in others. (A) Overall performance in the open field. Animals are awarded points (total = 72 points) for approximations to normal behavior on (B) general locomotion (limb use, placement, weight support, stepping and gait asymmetry; 34 points), (C) climbing (limb use during climbing, grip strength and retrieval of food items from cups at various heights; 16 points), and (D) object manipulation (posture, forelimb and finger movements while eating an apple or an orange, or during retrieval of food items from a Kong toy; 22 points). The overall score was derived by summing the subscore points for performance on all three activities (Table 3). A subset of animals (subjects #5, 6, 7, and 8) also were trained to perform four tasks with their impaired forelimb while seated in a standard primate-restraining chair; performance is shown as the proportion of trials where the reinforcer was successfully transferred to the mouth. These tasks involved retrieval of food rewards (e.g., grape, raisin, apple piece, etc.) from a platform (E), from the top of a vertical post/stick (F), from a 7-slot Brinkman board (H), or for pulling and holding a U-shaped handle attached to springs of varying stiffness (G). Two of the four subjects tested were able to successfully transfer food rewards to their mouth when performing all of these tasks (subjects #5 and #8). Sustained residual deficits in pincer grasp were evident on the Brinkman board task for all subjects. Red asterisk indicates pre-operative baseline performance.
<b>FIG. 7.</b>
FIG. 7.
Results of the Von Frey Hair (VFH) sensory assessment. (A) Schematic drawing of the monkey with the stimulation sites indicated as white dots. (B) Response category distribution for the different VFH stimulation sites pre-injury (n = 3) and post–spinal cord injury (n = 4). Response rate (either segmental or supraspinal) was about 50% with the hand stimulation producing the most responses. No wince or vocalizations were ever recorded; thus, supraspinal responses included only orientation or activity arrest. False alarm trials almost never produced a response. (C, D) The graphs show the interaction effect between the binned weeks post-lesion (x-axis) and the color-coded locations with the mean maximum force (C) and the mean response (D) on the y-axis (0 = no response, 1 = spinal responses and 2 = supraspinal responses). The thoracic location (D) shows an increase in supraspinal responses at the 9–10 weeks post-lesion followed by a decrease at the latest time-point. Data are averaged across all subjects tested (n = 4). Means represent estimated marginal means ± standard error of the mean.
<b>FIG. 8.</b>
FIG. 8.
Results of the modified Ashworth scoring. Using the modified Ashworth scoring system (see Methods for details), there was a significant increase in tone observed over the post-contusion survival period across all subjects tested (n = 4; error bars represent standard error of the mean). EMM, estimated marginal means.
<b>FIG. 9.</b>
FIG. 9.
The results of a principal components analysis (PCA) evaluating the relationship between all biomechanical, histological, and open field behavioral outcomes for subjects with contusion lesions (n = 7). Note that chair task performance was excluded from this analysis because only a subset of the animals was trained and tested on these tasks. (A) PCA revealed a principal component (PC1) that accounted for 42.1% of the variance in the dataset, and shows high loadings for peak force (0.95), % white matter sparing (0.85), and total open field score (0.83), which are inversely correlated to the lesion volume (−0.91). (B) Using the PCA-derived composite scores for each monkey, grouped as either baseline (pre-injury) or lesion (post-injury), a general linear model of these group PC scores for PC1 was tested. PC1 was significantly predicted by the injury, compared with baseline values (**p < 0.001).
<b>FIG. 10.</b>
FIG. 10.
Assessment of the association between early behavioral performance (first 3 weeks), biomechanical variables, and terminal histology. (A) The principal components analysis (PCA) evaluating the relationship between all biomechanical, histological, and early recovery variables yielded a first principle component accounting for 43.6% of the variance, which was very similar to that determined for the entire recovery period (Fig. 9). The same high loadings on PC1 for peak force, exercise cage performance, and % sparing at the lesion site were revealed in this analysis. This indicates the high degree of association between the biomechanical variables obtained at the time of surgery and early recovery (as well as anatomical outcomes). (B) A univariate Pearson correlational analysis showed a similar strong correlation between contusion peak force and function at 2 weeks. Both of these analyses suggest that the biomechanical variables, which are available at the time of surgery, can well predict the short and long term recovery, as well as the anatomical outcomes, making them useful for counterbalancing groups in treatment trials.
<b>FIG. 11.</b>
FIG. 11.
Corticospinal tract (CST) projections after a right C7 spinal cord contusion injury and anterograde labeling of the left primary motor cortex using biotinylated dextran amine (BDA; subject #5). Sections above (A-E), at (F-K), and below (L-Q) the lesion are shown. An adjacent orientation section stained with eriochrome cyanine (EC) and neutral red is shown at the far left of each panel and reveals the lesion and gray and white matter sparing. At C6 and 5.2 mm above the lesion, a high density of labeled CST fibers (A) were observed in the lateral funiculus coursing medially (E, small arrows) to distribute to the base of the dorsal horn, the intermediate zone, the ventral horn (B-C), and central canal area (D). CST projections also were found in the dorsolateral and ventromedial tracts contralaterally (data not shown). At the lesion epicenter (C6-7), descending BDA-labeled fibers were only detected laterally (F), and were not observed to project into the gray matter (G) or crossing the central canal (I). Remaining CST projections at the lesion margin formed retraction bulbs (H). Contralateral to the lesion, descending fibers (ipsilateral to side of cortical labeling) were present in the dorsolateral (J) and ventromedial (K) CST. Below the lesion (at C7-C8, and 5.2 mm caudal to the lesion epicenter), remaining CST projections continued to descend in the lateral funiculus (L) and were observed to re-establish terminal distributions in the intermediate gray, ventral horn (M-O), and central canal (P) via streams of axons crossing the area where CST fibers had been interrupted by the lesion (Q, small arrows). This area of CST degeneration is devoid of myelin staining (note the pink area in dorsolateral funiculus in the EC-stained orientation section at far left) demarcating the degenerated CST below the lesion. BDA-labeled fibers in dorsolateral and ventromedial tracts were detected on the side contralateral to the lesion at all levels (data only shown for the lesion epicenter J, K). A Nissl counterstained section below the lesion demonstrates CST terminal projections to motor neurons in the ventral horn (O). Scale bar for orientation sections = 4 mm; scale bar in L = 400 μm and applies to A and F; scale bar in N = 50 μm and applies to C, H and O; scale bar in Q = 300 μm and applies to B, D, E, G, I, J, K, M, and P. Ipsi MN Pool, ipsilateral motor neuron pool; cc, central canal.
<b>FIG. 12.</b>
FIG. 12.
Corticospinal tract (CST) projections from an animal with a more severe SCI (subject #6). Sections were selected at the lesion epicenter and at equal distances as those shown in Figure 11 (at C6-C7, 5.2 mm rostral, and at C8, 5.2 mm caudal to the lesion epicenter). Regions above (A-F), at (G-L), and below (M-Q) the lesion are shown. Eriochrome cyanine–stained orientation sections also are presented on the far left to demonstrate the areas of demyelination and the lesion boundaries. Above the lesion, although to a lesser extent than in the previous case, CST projections can be seen in the lateral funiculus (A), ventral horn (B-D), central canal area (E), and dorsolateral funiculus (F). The Nissl counterstained inset shown in (C) was taken from an adjacent section at that same level and region as in (D) and shows terminal arborizations in the vicinity of motor neurons. At the lesion epicenter, (C6-7), ipsilateral to the lesion (G-H), biotinylated dextran amine–labeled fibers were only seen laterally in the dorsal lateral funiculus, and those close to the lesion margin exhibited retraction-bulbs (I). Contralateral to the lesion, CST fibers were observed in the dorsolateral (K) tract but almost no fibers were observed in ventromedial (L) tract, likely due to the lesion extending across the midline. Below the lesion (C8), few CST fibers were observed to project out of the main tract and course medially (Q, small arrows) to terminate in the intermediate gray, ventral horn (M-O), and central canal area (P). Note the differences in density of CST fibers between subjects #5 and #6 are likely due to variations in lesion severity as the tract labeling seemed comparable between the two cases (supplementary Fig. S3). Scale bar for orientation sections = 4 mm; scale bar in M = 400 μm and applies to A and G; scale bar in O = 50 μm and applies to C, D, and I; scale bar in Q = 300 μm and applies to B, E, F, H, J-L, N, and P.

Similar articles

Cited by

References

    1. Geissler S.A., Schmidt C.E., and Schallert T. (2013). Rodent models and behavioral outcomes of cervical spinal cord injury. J. Spine Suppl. 4, 001 - PMC - PubMed
    1. Streijger F., Beernink T.M., Lee J.H., Bhatnagar T., Park S., Kwon B.K., and Tetzlaff W. (2013). Characterization of a cervical spinal cord hemicontusion injury in mice using the infinite horizon impactor. J. Neurotrauma 30, 869–883 - PubMed
    1. Lee J.H., Streijger F., Tigchelaar S., Maloon M., Liu J., Tetzlaff W., and Kwon B.K. (2012). A contusive model of unilateral cervical spinal cord injury using the infinite horizon impactor. J. Vis. Exp. 65, 3313. - PMC - PubMed
    1. Russell C.M., Choo A.M., Tetzlaff W., Chung T.E., and Oxland T.R. (2012). Maximum principal strain correlates with spinal cord tissue damage in contusion and dislocation injuries in the rat cervical spine. J. Neurotrauma 29, 1574–1585 - PubMed
    1. Anderson K.D., Sharp K.G., and Steward O. (2009). Bilateral cervical contusion spinal cord injury in rats. Exp. Neurol. 220, 9–22 - PMC - PubMed

Publication types