

Positive changes in ideal CVH metrics reduce the incidence of stroke
- PMID: 26790535
- PMCID: PMC4726201
- DOI: 10.1038/srep19673
Positive changes in ideal CVH metrics reduce the incidence of stroke
Abstract
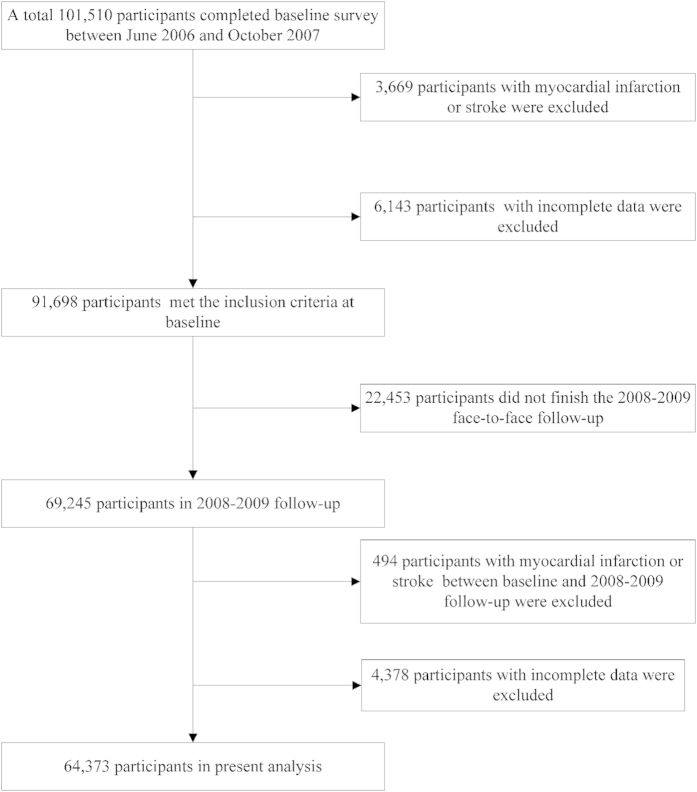
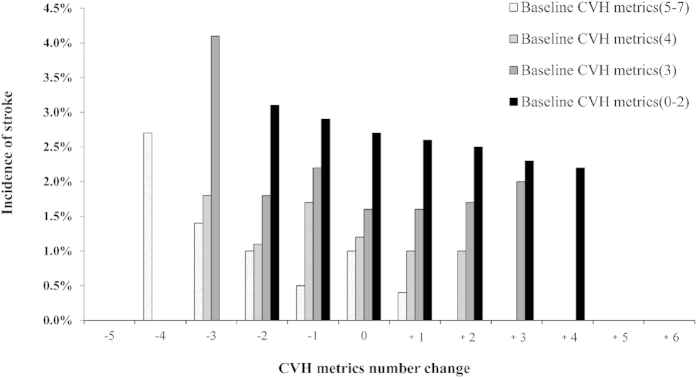
The American Heart Association defined 7 ideal cardiovascular health (CVH) metrics and the benefits of them in reducing the incidence of stroke are well established, but it is unclear whether changes in them alter stroke risk. We calculated the changes of 7 ideal CVH metrics from 2006 to 2008 among 64,373 participants in the Kailuan study. We tested whether changes in the numbers and total scores for the CVH metrics were associated with the incidence of stroke in the 4.89 person-years follow-up. Cox regression modeling was used to estimate the risk of stroke. By year 2008, CVH metrics number of 32.54% participants improved (change ≥+1); 31.90% deteriorated (≤-1); 35.56% stayed the same; In the follow-up,we identified1,182 incident stroke events. Each increase in CVH metrics and every 1-point increase in total CVH score from 2006 to 2008 were associated with reduced odds of total stroke (hazard ratio = 0.87; 95% confidence interval; 0.83-0.92 and 0.89[0.86-0.92] respectively), after adjusting for age, gender, educational level, income and scores for the metrics of ideal CVH at baseline. Positive changes in ideal CVH metrics reduce the incidence of stroke. Our results support the concept that achieving ideal CVH helps to prevent stroke.
Figures
Similar articles
-
Ideal cardiovascular health metrics and the risks of ischemic and intracerebral hemorrhagic stroke.Stroke. 2013 Sep;44(9):2451-6. doi: 10.1161/STROKEAHA.113.678839. Epub 2013 Jul 18. Stroke. 2013. PMID: 23868276
-
Ideal cardiovascular health and incidence of atherosclerotic cardiovascular disease among Chinese adults: the China-PAR project.Sci China Life Sci. 2018 May;61(5):504-514. doi: 10.1007/s11427-018-9281-6. Epub 2018 Mar 19. Sci China Life Sci. 2018. PMID: 29721777
-
The American Heart Association Ideal Cardiovascular Health and Incident Type 2 Diabetes Mellitus Among Blacks: The Jackson Heart Study.J Am Heart Assoc. 2017 Jun 21;6(6):e005008. doi: 10.1161/JAHA.116.005008. J Am Heart Assoc. 2017. PMID: 28637777 Free PMC article.
-
Association between ideal cardiovascular health metrics and risk of cardiovascular events or mortality: A meta-analysis of prospective studies.Clin Cardiol. 2017 Dec;40(12):1339-1346. doi: 10.1002/clc.22836. Epub 2017 Dec 26. Clin Cardiol. 2017. PMID: 29278429 Free PMC article. Review.
-
Ideal Cardiovascular Health and Incident Cardiovascular Disease Among Adults: A Systematic Review and Meta-analysis.Mayo Clin Proc. 2018 Nov;93(11):1589-1599. doi: 10.1016/j.mayocp.2018.05.035. Epub 2018 Sep 28. Mayo Clin Proc. 2018. PMID: 30274906
Cited by
-
Modified Ideal Cardiovascular Health Status is Associated with Lower Prevalence of Stroke in Rural Northeast China.Int J Environ Res Public Health. 2016 Feb 6;13(2):207. doi: 10.3390/ijerph13020207. Int J Environ Res Public Health. 2016. PMID: 26861368 Free PMC article.
-
Gender differences in the association between Life's essential 8 and cardiovascular disease: a U.S.-based cross-sectional analysis.Nutr Metab (Lond). 2025 May 7;22(1):38. doi: 10.1186/s12986-025-00929-w. Nutr Metab (Lond). 2025. PMID: 40336000 Free PMC article.
-
Metrics of Ideal Cardiovascular Health are Unequally Distributed between Peruvian Men and Women: Analysis of a National Population-Based Survey in 2017.Int J Prev Med. 2020 Dec 11;11:190. doi: 10.4103/ijpvm.IJPVM_326_19. eCollection 2020. Int J Prev Med. 2020. PMID: 33815714 Free PMC article.
-
Ideal cardiovascular health and the subclinical impairments of cardiovascular diseases: a cross-sectional study in central south China.BMC Cardiovasc Disord. 2017 Oct 18;17(1):269. doi: 10.1186/s12872-017-0697-9. BMC Cardiovasc Disord. 2017. PMID: 29047374 Free PMC article.
-
Demographic and socioeconomic inequalities in ideal cardiovascular health: A systematic review and meta-analysis.PLoS One. 2021 Aug 11;16(8):e0255959. doi: 10.1371/journal.pone.0255959. eCollection 2021. PLoS One. 2021. PMID: 34379696 Free PMC article.
References
-
- Lloyd-Jones D. M. et al. Defining and setting national goals for cardiovascular health promotion and disease reduction: the American Heart Association’s strategic Impact Goal through 2020 and beyond. Circulation. 121, 586–613 (2010). - PubMed
-
- Laitinen T. T. et al. Ideal cardiovascular health in childhood and cardiometabolic outcomes in adulthood: the Cardiovascular Risk in Young Finns Study. Circulation. 125, 1971–1978 (2012). - PubMed
-
- Wu S. et al. Prevalence of ideal cardiovascular health and its relationship with the 4-year cardiovascular events in a northern Chinese industrial city. Circ Cardiovasc Qual Outcomes. 5, 487–493 (2012). - PubMed
Publication types
MeSH terms
LinkOut - more resources
Full Text Sources
Other Literature Sources
Medical
