

Self-enforcing regional vaccination agreements
- PMID: 26790996
- PMCID: PMC4759795
- DOI: 10.1098/rsif.2015.0907
Self-enforcing regional vaccination agreements
Abstract
In a highly interconnected world, immunizing infections are a transboundary problem, and their control and elimination require international cooperation and coordination. In the absence of a global or regional body that can impose a universal vaccination strategy, each individual country sets its own strategy. Mobility of populations across borders can promote free-riding, because a country can benefit from the vaccination efforts of its neighbours, which can result in vaccination coverage lower than the global optimum. Here we explore whether voluntary coalitions that reward countries that join by cooperatively increasing vaccination coverage can solve this problem. We use dynamic epidemiological models embedded in a game-theoretic framework in order to identify conditions in which coalitions are self-enforcing and therefore stable, and thus successful at promoting a cooperative vaccination strategy. We find that countries can achieve significantly greater vaccination coverage at a lower cost by forming coalitions than when acting independently, provided a coalition has the tools to deter free-riding. Furthermore, when economically or epidemiologically asymmetric countries form coalitions, realized coverage is regionally more consistent than in the absence of coalitions.
Keywords: SIR model; epidemic dynamics; metapopulation; regional cooperation; transboundary movement.
© 2016 The Authors.
Figures
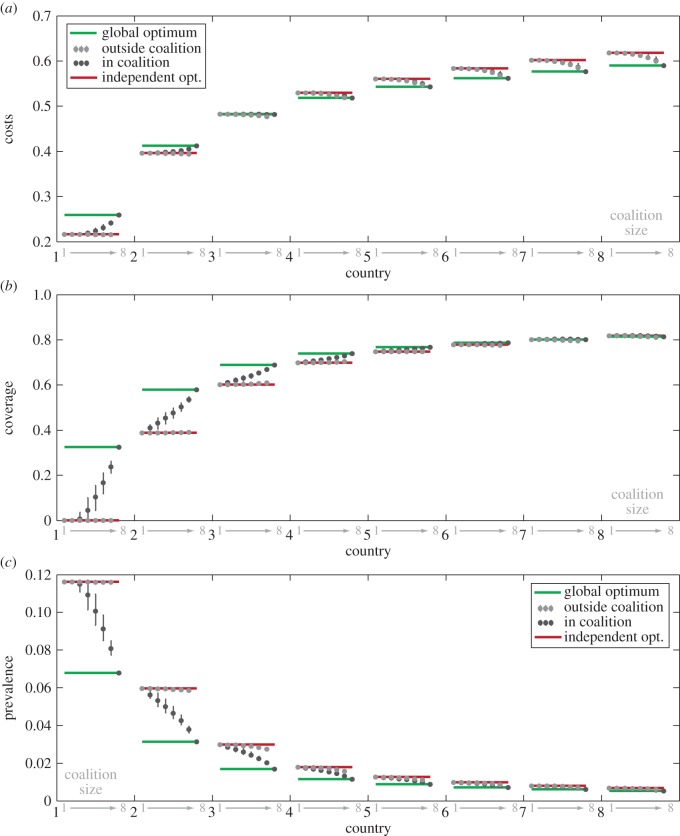
 possible coalitions of size k, and here we show the mean value and range of optimization outcomes for a given country in a coalition of a given size. Circles show mean costs (a), coverage (b) or prevalence (c) for each country and each coalition size when that country is in coalition (black) and outside of coalition (grey). Whiskers show fifth and 95th quantiles. Red and green lines show independent and global optimum for each country, respectively. Cost of infection parameter varies linearly across countries from cI1 = 1 for country 1, and cI8 = 15 for country 8. R0 = 5, coupling strength = 10μ/(n − 1), ai = 0.1. All 248 optimizations are shown in electronic supplementary material, figure S4.
References
-
- Huber V. 2006. The unification of the globe by disease? The International Sanitary Conferences on cholera, 1851–1894. Hist. J. 49, 453 (10.1017/S0018246X06005280) - DOI
-
- Anderson RM, May RM. 1991. Infectious diseases of humans. Oxford, UK: Oxford University Press.
-
- Keeling MJ, Rohani P. 2008. Modeling infectious diseases in humans and animals. Princeton, NJ: Princeton University Press.
Publication types
MeSH terms
Grants and funding
LinkOut - more resources
Full Text Sources
Other Literature Sources
Medical
