Comparison of the Value of Nursing Work Environments in Hospitals Across Different Levels of Patient Risk
- PMID: 26791112
- PMCID: PMC4957817
- DOI: 10.1001/jamasurg.2015.4908
Comparison of the Value of Nursing Work Environments in Hospitals Across Different Levels of Patient Risk
Abstract
Importance: The literature suggests that hospitals with better nursing work environments provide better quality of care. Less is known about value (cost vs quality).
Objectives: To test whether hospitals with better nursing work environments displayed better value than those with worse nursing environments and to determine patient risk groups associated with the greatest value.
Design, setting, and participants: A retrospective matched-cohort design, comparing the outcomes and cost of patients at focal hospitals recognized nationally as having good nurse working environments and nurse-to-bed ratios of 1 or greater with patients at control group hospitals without such recognition and with nurse-to-bed ratios less than 1. This study included 25 752 elderly Medicare general surgery patients treated at focal hospitals and 62 882 patients treated at control hospitals during 2004-2006 in Illinois, New York, and Texas. The study was conducted between January 1, 2004, and November 30, 2006; this analysis was conducted from April to August 2015.
Exposures: Focal vs control hospitals (better vs worse nursing environment).
Main outcomes and measures: Thirty-day mortality and costs reflecting resource utilization.
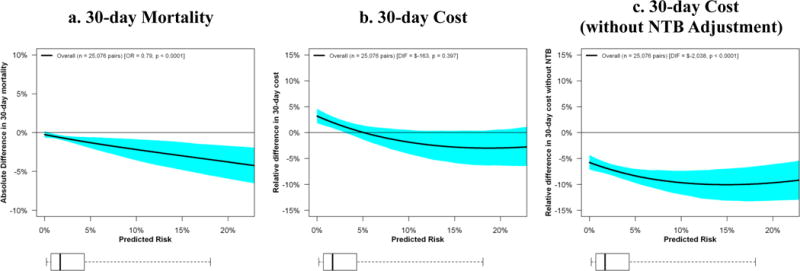
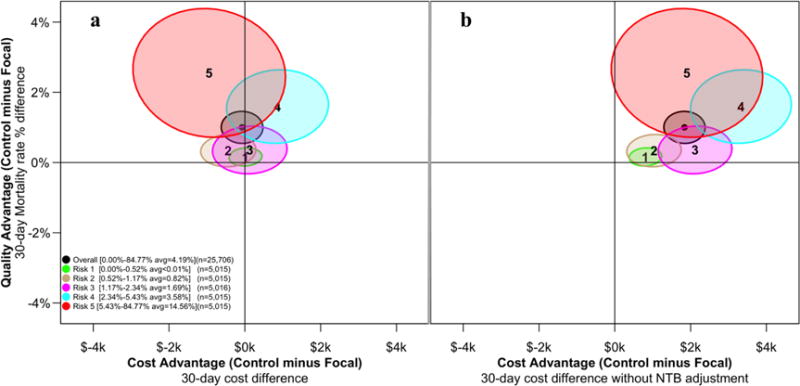
Results: This study was conducted at 35 focal hospitals (mean nurse-to-bed ratio, 1.51) and 293 control hospitals (mean nurse-to-bed ratio, 0.69). Focal hospitals were larger and more teaching and technology intensive than control hospitals. Thirty-day mortality in focal hospitals was 4.8% vs 5.8% in control hospitals (P < .001), while the cost per patient was similar: the focal-control was -$163 (95% CI = -$542 to $215; P = .40), suggesting better value in the focal group. For the focal vs control hospitals, the greatest mortality benefit (17.3% vs 19.9%; P < .001) occurred in patients in the highest risk quintile, with a nonsignificant cost difference of $941 per patient ($53 701 vs $52 760; P = .25). The greatest difference in value between focal and control hospitals appeared in patients in the second-highest risk quintile, with mortality of 4.2% vs 5.8% (P < .001), with a nonsignificant cost difference of -$862 ($33 513 vs $34 375; P = .12).
Conclusions and relevance: Hospitals with better nursing environments and above-average staffing levels were associated with better value (lower mortality with similar costs) compared with hospitals without nursing environment recognition and with below-average staffing, especially for higher-risk patients. These results do not suggest that improving any specific hospital's nursing environment will necessarily improve its value, but they do show that patients undergoing general surgery at hospitals with better nursing environments generally receive care of higher value.
Conflict of interest statement
Disclosure of potential conflicts of interest: None
Figures
Comment in
-
Revisiting Nursing's Effect on Surgical Quality and Cost.JAMA Surg. 2016 Jun 1;151(6):536-7. doi: 10.1001/jamasurg.2015.4918. JAMA Surg. 2016. PMID: 26790400 No abstract available.
References
Publication types
MeSH terms
Grants and funding
LinkOut - more resources
Full Text Sources
Other Literature Sources
Medical
Miscellaneous