

Trastuzumab improves tumor perfusion and vascular delivery of cytotoxic therapy in a murine model of HER2+ breast cancer: preliminary results
- PMID: 26791520
- PMCID: PMC4833210
- DOI: 10.1007/s10549-016-3680-8
Trastuzumab improves tumor perfusion and vascular delivery of cytotoxic therapy in a murine model of HER2+ breast cancer: preliminary results
Abstract
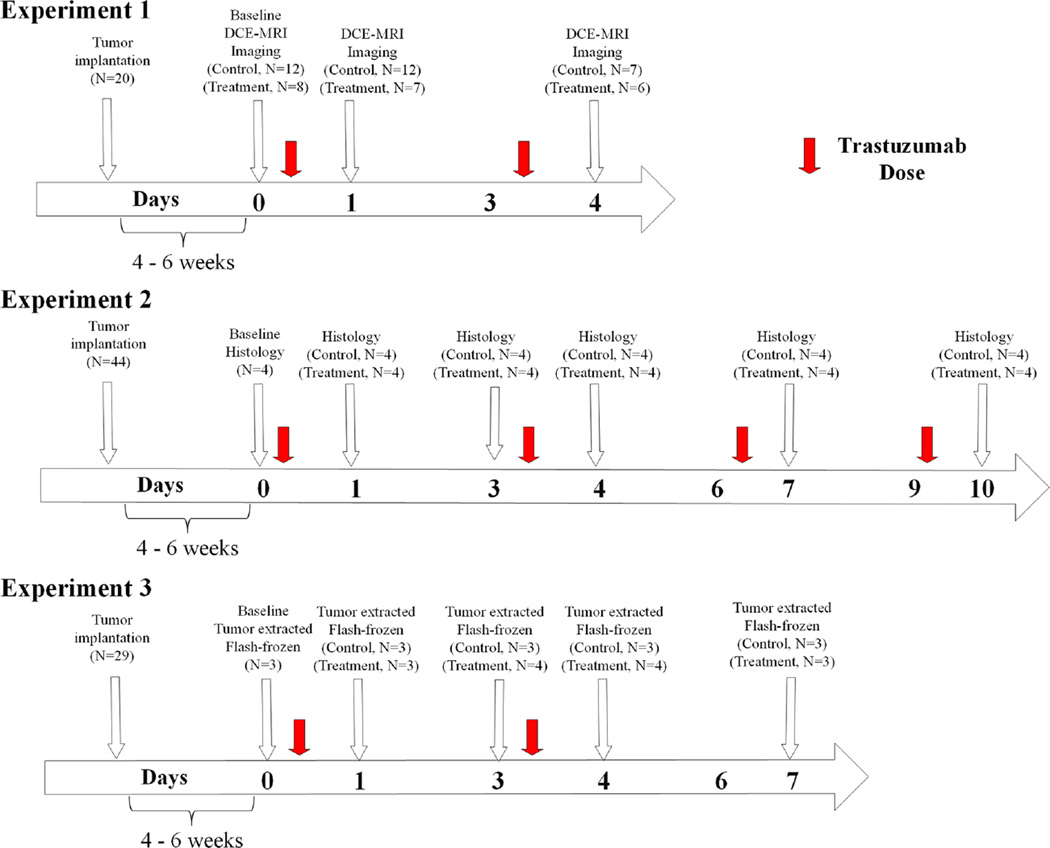
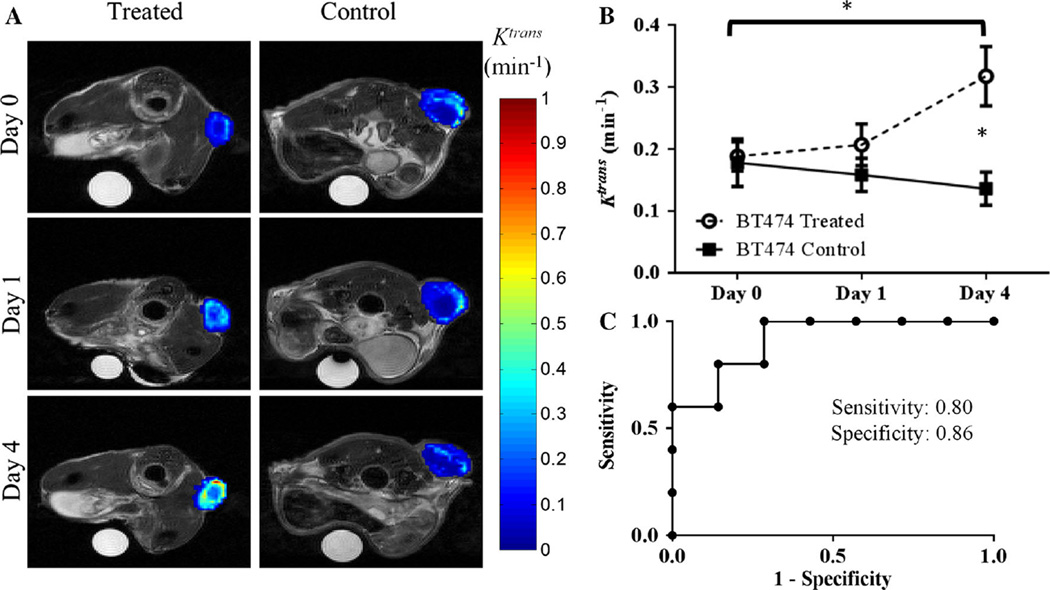
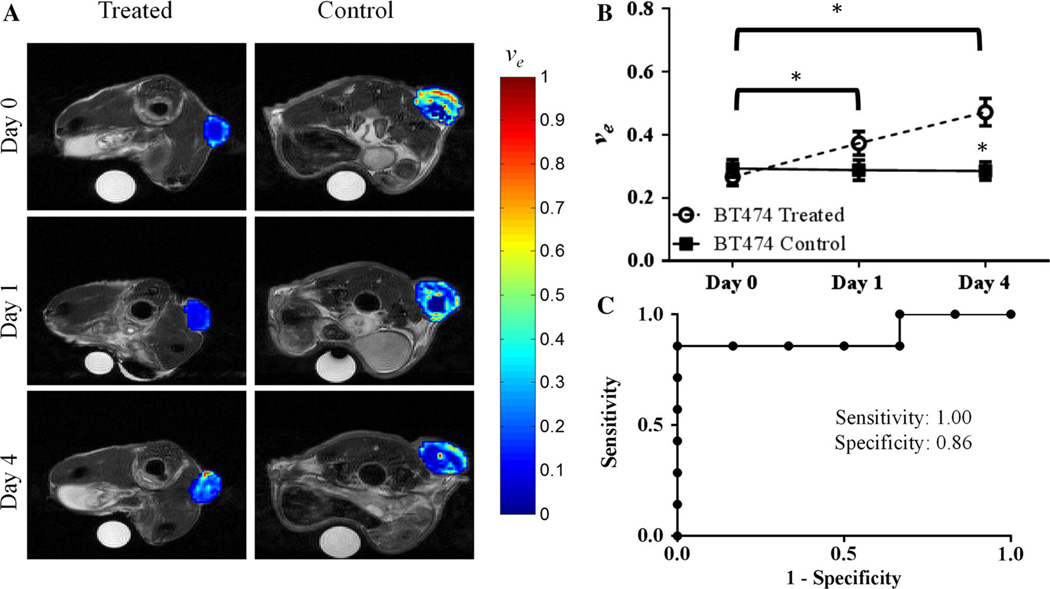
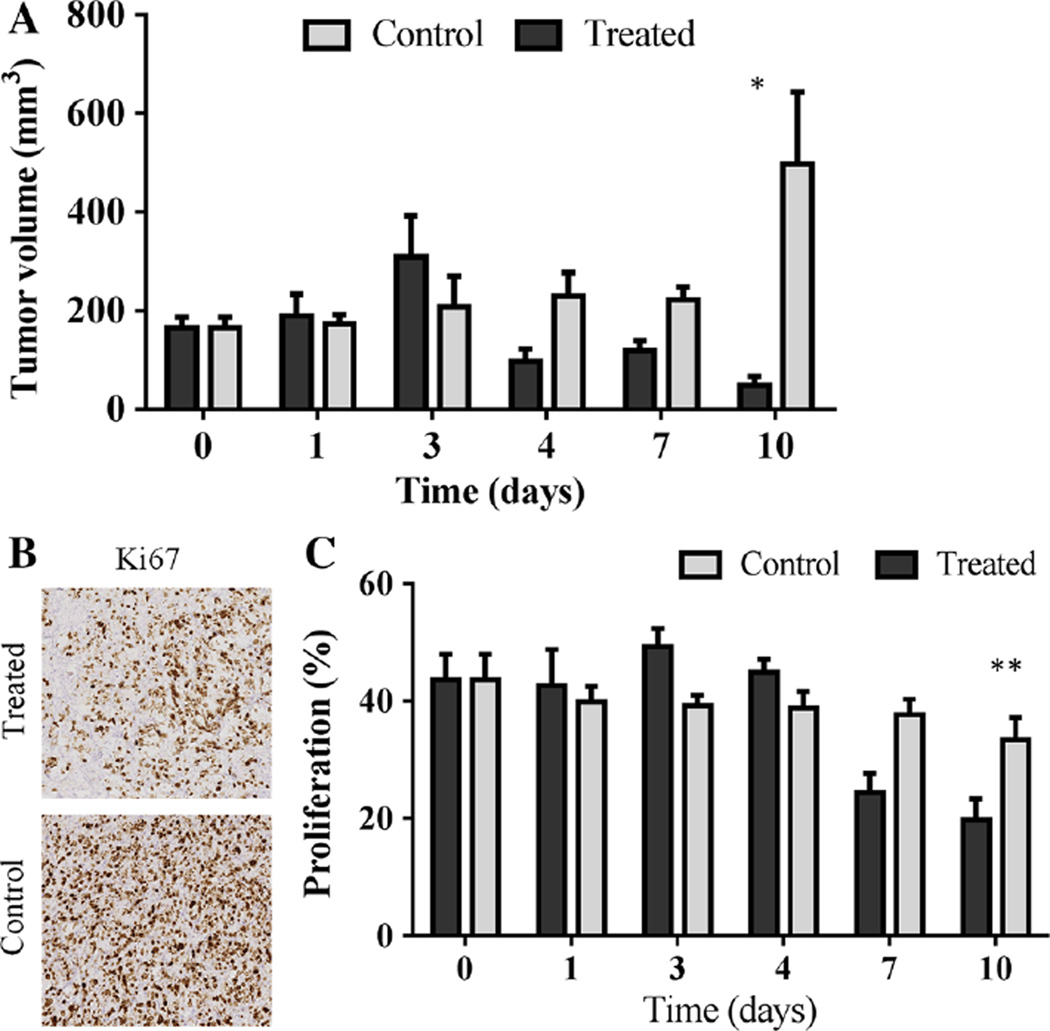
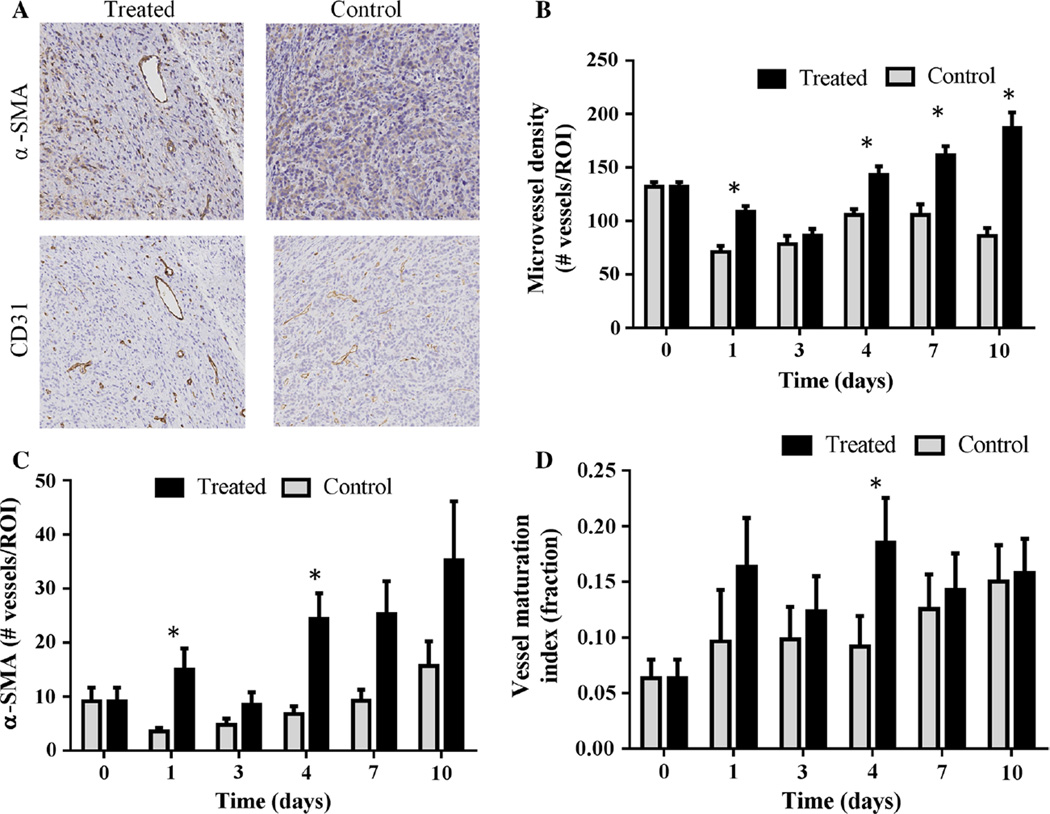
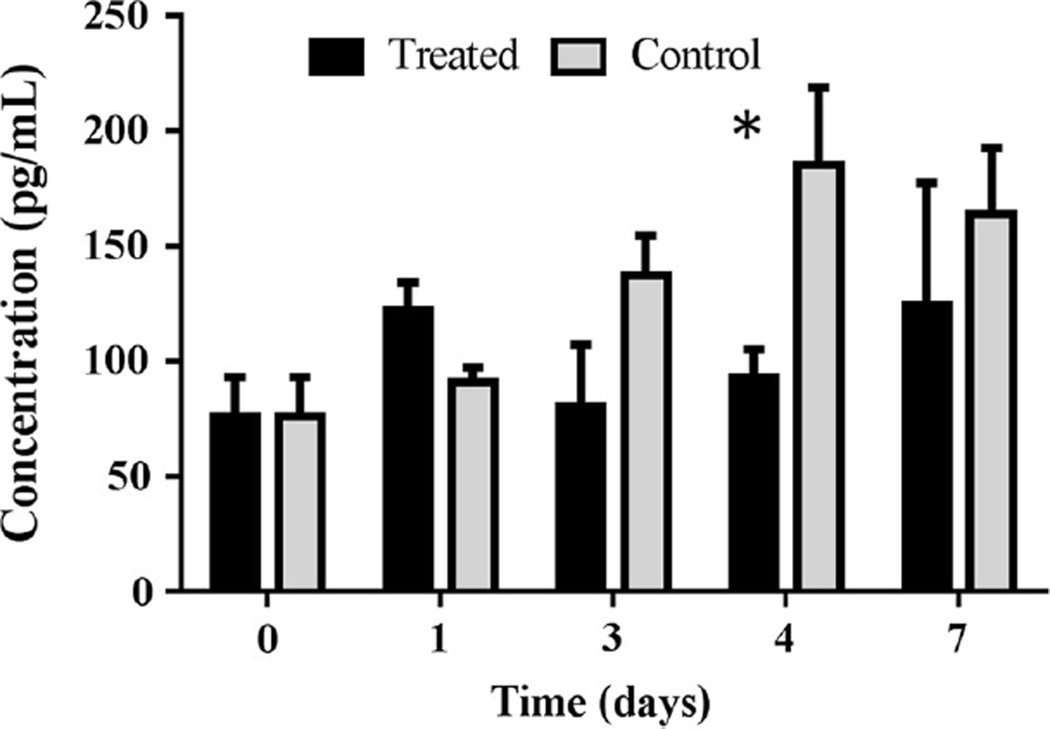
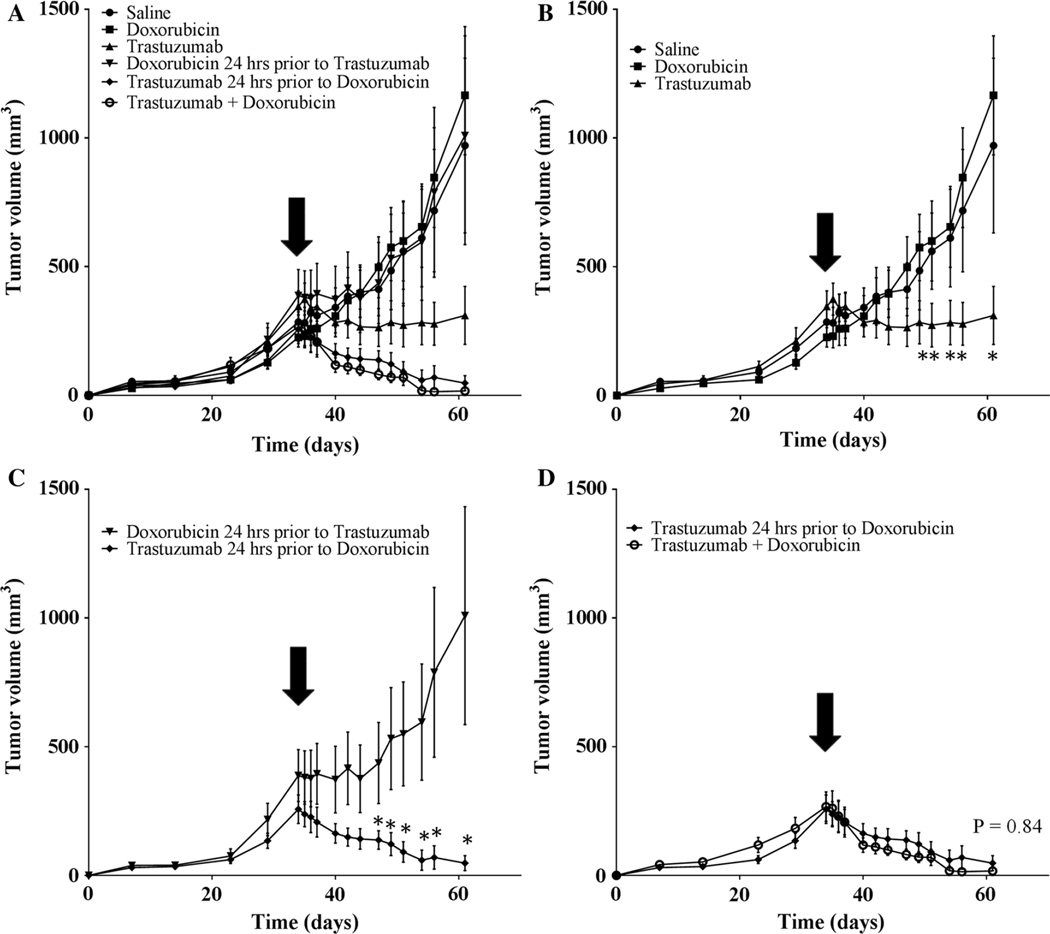
To employ in vivo imaging and histological techniques to identify and quantify vascular changes early in the course of treatment with trastuzumab in a murine model of HER2+ breast cancer. Dynamic contrast-enhanced magnetic resonance imaging (DCE-MRI) was used to quantitatively characterize vessel perfusion/permeability (via the parameter K (trans) ) and the extravascular extracellular volume fraction (v e ) in the BT474 mouse model of HER2+ breast cancer (N = 20) at baseline, day one, and day four following trastuzumab treatment (10 mg/kg). Additional cohorts of mice were used to quantify proliferation (Ki67), microvessel density (CD31), pericyte coverage (α-SMA) by immunohistochemistry (N = 44), and to quantify human VEGF-A expression (N = 29) throughout the course of therapy. Longitudinal assessment of combination doxorubicin ± trastuzumab (N = 42) tested the hypothesis that prior treatment with trastuzumab will increase the efficacy of subsequent doxorubicin therapy. Compared to control tumors, trastuzumab-treated tumors exhibited a significant increase in K (trans) (P = 0.035) on day four, indicating increased perfusion and/or vessel permeability and a simultaneous significant increase in v e (P = 0.01), indicating increased cell death. Immunohistochemical and ELISA analyses revealed that by day four the trastuzumab-treated tumors had a significant increase in vessel maturation index (i.e., the ratio of α-SMA to CD31 staining) compared to controls (P < 0.001) and a significant decrease in VEGF-A (P = 0.03). Additionally, trastuzumab dosing prior to doxorubicin improved the overall effectiveness of the therapies (P < 0.001). This study identifies and validates improved perfusion characteristics following trastuzumab therapy, resulting in an improvement in trastuzumab-doxorubicin combination therapy in a murine model of HER2+ breast cancer. This data suggests properties of vessel maturation. In particular, the use of DCE-MRI, a clinically available imaging method, following treatment with trastuzumab may provide an opportunity to optimize the scheduling and improve delivery of subsequent cytotoxic therapy.
Keywords: Adriamycin; Angiogenesis; BT474; Herceptin; Immunohistochemistry; MRI; Normalization.
Conflict of interest statement
Figures
Similar articles
-
Anti-HER2 induced myeloid cell alterations correspond with increasing vascular maturation in a murine model of HER2+ breast cancer.BMC Cancer. 2020 Apr 28;20(1):359. doi: 10.1186/s12885-020-06868-4. BMC Cancer. 2020. PMID: 32345237 Free PMC article.
-
Specific blockade of VEGF and HER2 pathways results in greater growth inhibition of breast cancer xenografts that overexpress HER2.Cell Cycle. 2008 Dec;7(23):3747-58. doi: 10.4161/cc.7.23.7212. Epub 2008 Dec 16. Cell Cycle. 2008. PMID: 19029832 Free PMC article.
-
Characterizing Trastuzumab-Induced Alterations in Intratumoral Heterogeneity with Quantitative Imaging and Immunohistochemistry in HER2+ Breast Cancer.Neoplasia. 2019 Jan;21(1):17-29. doi: 10.1016/j.neo.2018.10.008. Epub 2018 Nov 23. Neoplasia. 2019. PMID: 30472501 Free PMC article.
-
Heterogeneous distribution of trastuzumab in HER2-positive xenografts and metastases: role of the tumor microenvironment.Clin Exp Metastasis. 2018 Oct;35(7):691-705. doi: 10.1007/s10585-018-9929-3. Epub 2018 Sep 8. Clin Exp Metastasis. 2018. PMID: 30196384 Free PMC article.
-
Integrating biological agents into systemic therapy of breast cancer: trastuzumab, lapatinib, bevacizumab.J BUON. 2007 Sep;12 Suppl 1:S119-26. J BUON. 2007. PMID: 17935269 Review.
Cited by
-
Photoacoustic imaging for the evaluation of early tumor response to antivascular treatment.Quant Imaging Med Surg. 2019 Feb;9(2):160-170. doi: 10.21037/qims.2018.11.06. Quant Imaging Med Surg. 2019. PMID: 30976540 Free PMC article.
-
Extracellular Matrix Features Discriminate Aggressive HER2-Positive Breast Cancer Patients Who Benefit from Trastuzumab Treatment.Cells. 2020 Feb 13;9(2):434. doi: 10.3390/cells9020434. Cells. 2020. PMID: 32069815 Free PMC article.
-
Endostar Rebuilding Vascular Homeostasis and Enhancing Chemotherapy Efficacy in Cervical Cancer Treatment.Onco Targets Ther. 2020 Dec 14;13:12811-12827. doi: 10.2147/OTT.S277644. eCollection 2020. Onco Targets Ther. 2020. PMID: 33363386 Free PMC article.
-
Multiparametric MR for non-invasive evaluation of tumour tissue histological characteristics after radionuclide therapy.NMR Biomed. 2019 Mar;32(3):e4060. doi: 10.1002/nbm.4060. Epub 2019 Jan 28. NMR Biomed. 2019. PMID: 30693592 Free PMC article.
-
Amniotic epithelial cells reverse abnormal vascular structure and function in endometrial carcinoma.Int J Clin Exp Pathol. 2019 Jul 1;12(7):2405-2424. eCollection 2019. Int J Clin Exp Pathol. 2019. PMID: 31934068 Free PMC article.
References
-
- Dean-Colomb W, Esteva FJ. Her2-positive breast cancer: herceptin and beyond. Eur J Cancer. 2008;44(18):2806–2812. - PubMed
-
- Spector NL, Blackwell KL. Understanding the mechanisms behind trastuzumab therapy for human epidermal growth factor receptor 2-positive breast cancer. J Clin Oncol. 2009;27(34):5838–5847. - PubMed
-
- Cho HS, Mason K, Ramyar KX, Stanley AM, Gabelli SB, Denney DW, Jr, Leahy DJ. Structure of the extracellular region of HER2 alone and in complex with the Herceptin Fab. Nature. 2003;421(6924):756–760. - PubMed
Publication types
MeSH terms
Substances
Grants and funding
- P30CA68485/CA/NCI NIH HHS/United States
- R01 CA138599/CA/NCI NIH HHS/United States
- R25 CA092043/CA/NCI NIH HHS/United States
- P50 CA098131/CA/NCI NIH HHS/United States
- 5T32CA093240/CA/NCI NIH HHS/United States
- P30 CA068485/CA/NCI NIH HHS/United States
- R01CA138599/CA/NCI NIH HHS/United States
- U01CA174706/CA/NCI NIH HHS/United States
- T32 CA093240/CA/NCI NIH HHS/United States
- U01 CA174706/CA/NCI NIH HHS/United States
- P50CA098131/CA/NCI NIH HHS/United States
- R25CA092043/CA/NCI NIH HHS/United States
- K12 CA090625/CA/NCI NIH HHS/United States
LinkOut - more resources
Full Text Sources
Other Literature Sources
Medical
Research Materials
Miscellaneous
