

Deuterium Labeling Together with Contrast Variation Small-Angle Neutron Scattering Suggests How Skp Captures and Releases Unfolded Outer Membrane Proteins
- PMID: 26791979
- PMCID: PMC4913355
- DOI: 10.1016/bs.mie.2015.06.041
Deuterium Labeling Together with Contrast Variation Small-Angle Neutron Scattering Suggests How Skp Captures and Releases Unfolded Outer Membrane Proteins
Abstract
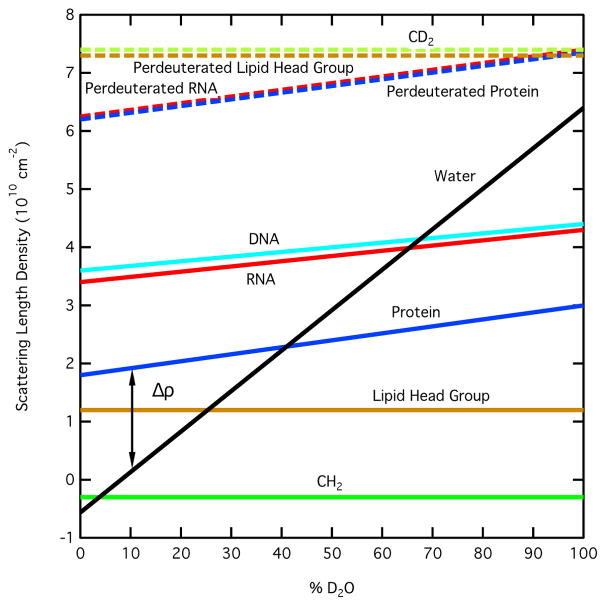
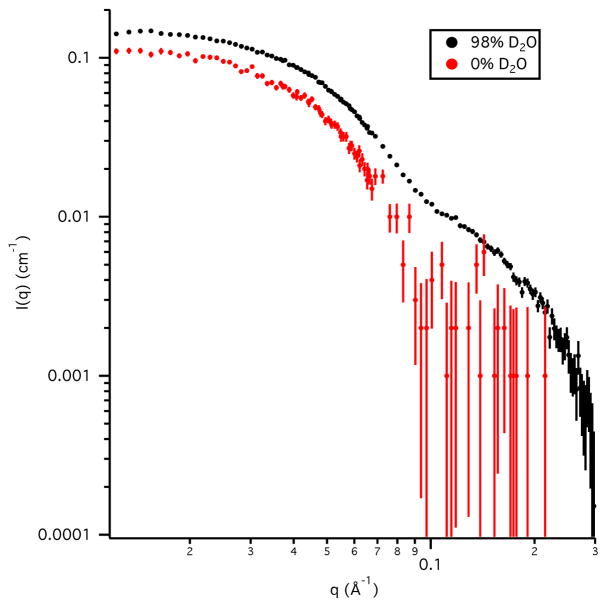
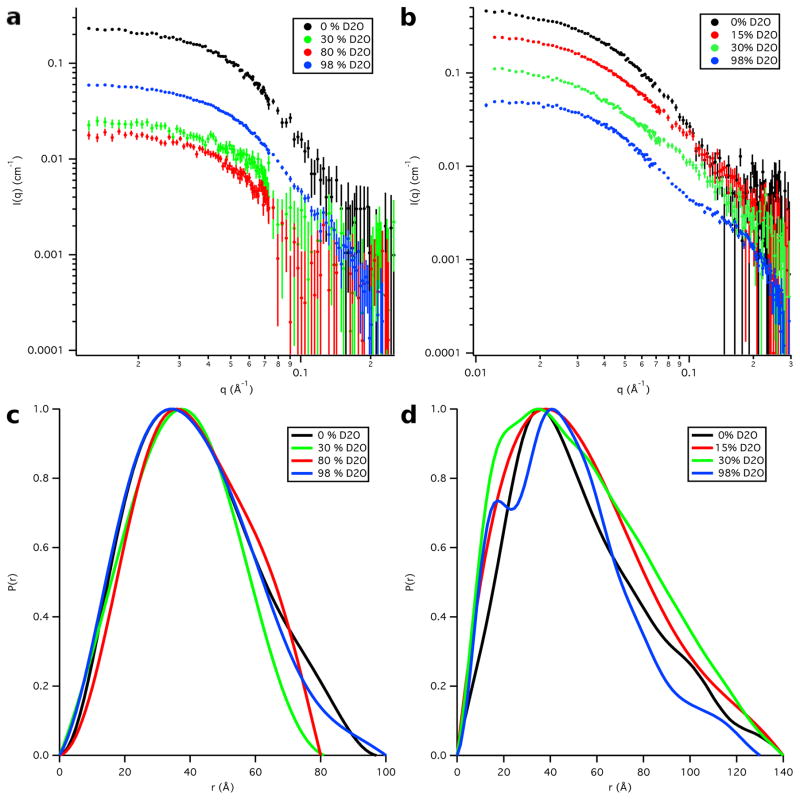
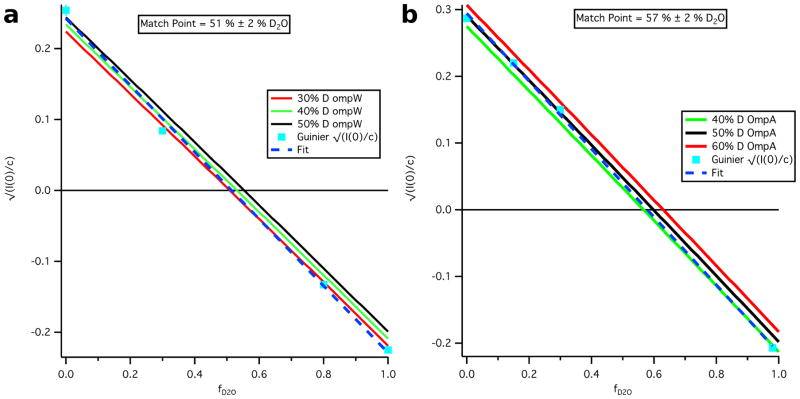
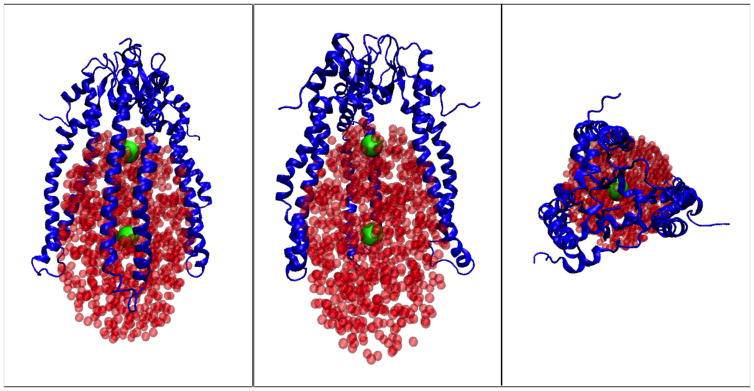
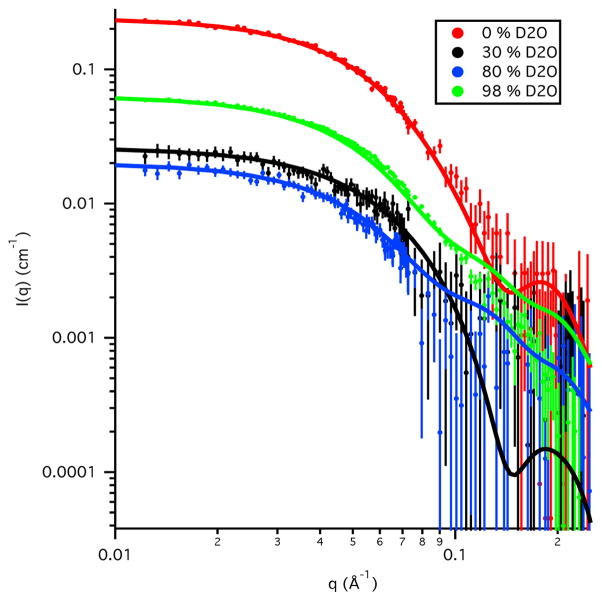
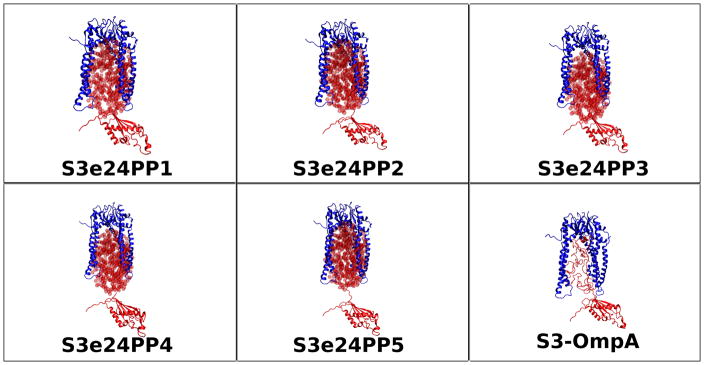
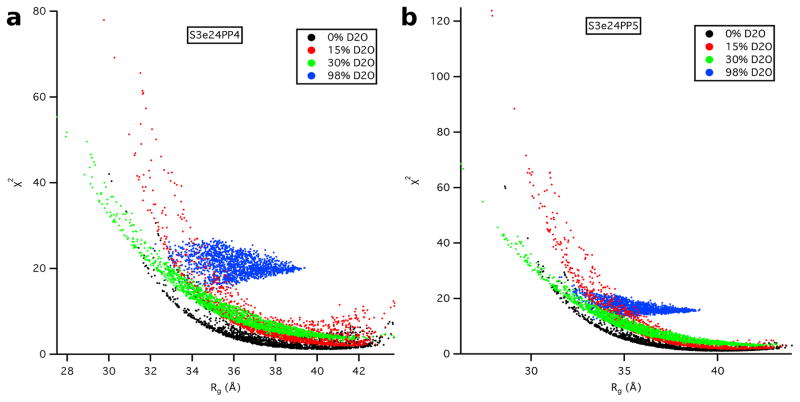
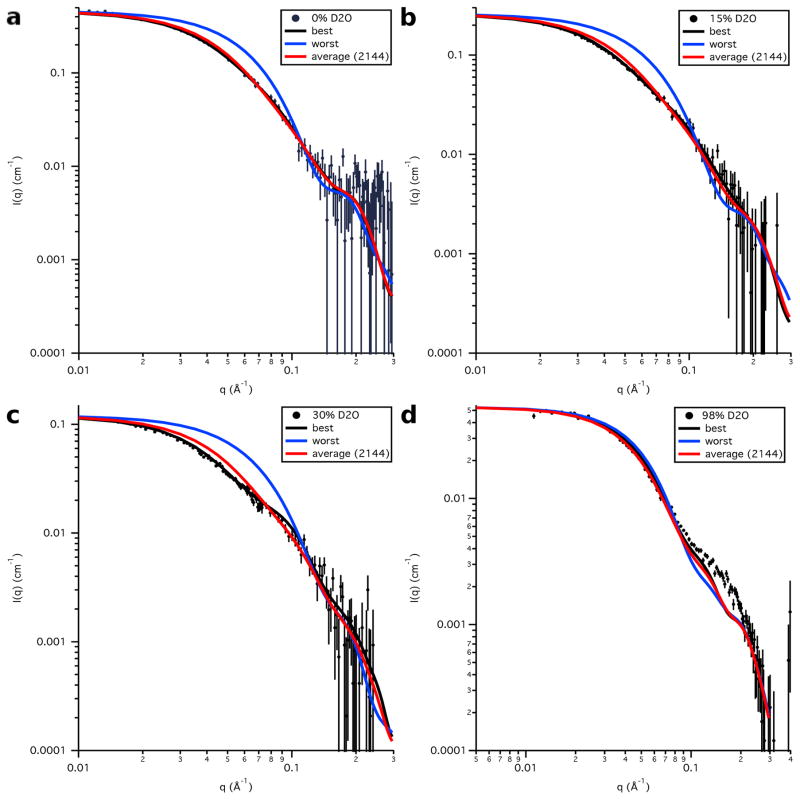
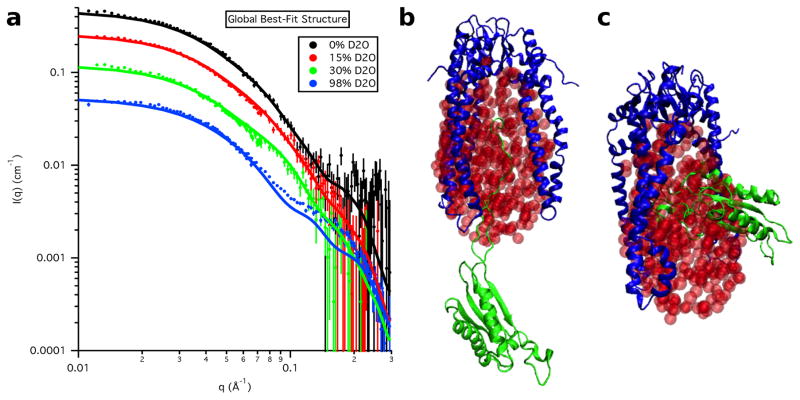
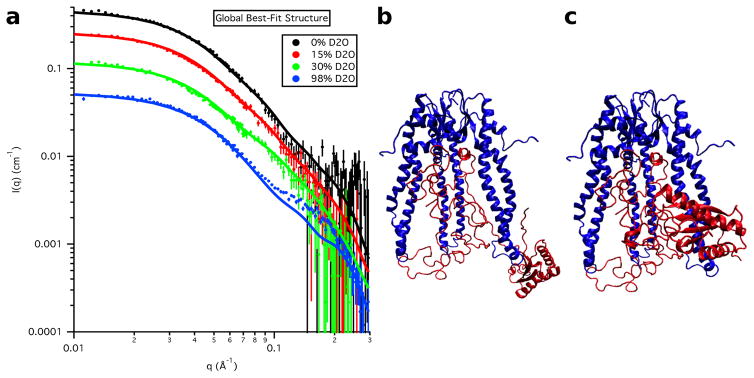
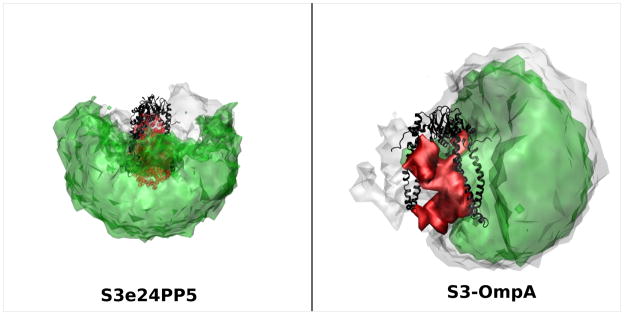
In Gram-negative bacteria, the chaperone protein Skp forms specific and stable complexes with membrane proteins while they are transported across the periplasm to the outer membrane. The jellyfish-like architecture of Skp is similar to the eukaryotic and archaeal prefoldins and the mitochondrial Tim chaperones, that is the α-helical "tentacles" extend from a β-strand "body" to create an internal cavity. Contrast variation small-angle neutron scattering (SANS) experiments on Skp alone in solution and bound in two different complexes to unfolded outer membrane proteins (uOMPs), OmpA and OmpW, demonstrate that the helical tentacles of Skp bind their substrate in a clamp-like mechanism in a conformation similar to that previously observed in the apo crystal structure of Skp. Deuteration of the uOMP component combined with contrast variation analysis allowed the shapes of Skp and uOMP as well as the location of uOMP with respect to Skp to be determined in both complexes. This represents unique information that could not be obtained without deuterium labeling of the uOMPs. The data yield the first direct structural evidence that the α-helical Skp tentacles move closer together on binding its substrate and that the structure of Skp is different when binding different uOMPs. This work presents, by example, a tutorial on performing SANS experiments using both deuterium labeling and contrast variation, including SANS theory, sample preparation, data collection, sample quality validation, data analysis, and structure modeling.
Keywords: Disordered protein; Holdase; Jellyfish-like chaperone; Outer membrane protein (OMP) transport; Periplasm; SANS; Skp; Small-angle neutron scattering.
© 2016 Elsevier Inc. All rights reserved.
Figures
Similar articles
-
Biomolecular Deuteration for Neutron Structural Biology and Dynamics.Methods Enzymol. 2016;566:113-57. doi: 10.1016/bs.mie.2015.11.001. Epub 2015 Dec 22. Methods Enzymol. 2016. PMID: 26791978
-
The trimeric periplasmic chaperone Skp of Escherichia coli forms 1:1 complexes with outer membrane proteins via hydrophobic and electrostatic interactions.J Mol Biol. 2007 Nov 16;374(1):91-105. doi: 10.1016/j.jmb.2007.09.020. Epub 2007 Sep 14. J Mol Biol. 2007. PMID: 17928002
-
Data analysis and modeling of small-angle neutron scattering data with contrast variation from bio-macromolecular complexes.Methods Enzymol. 2023;678:55-96. doi: 10.1016/bs.mie.2022.09.015. Epub 2022 Oct 31. Methods Enzymol. 2023. PMID: 36641217
-
Small-angle neutron scattering contrast variation studies of biological complexes: Challenges and triumphs.Curr Opin Struct Biol. 2022 Jun;74:102375. doi: 10.1016/j.sbi.2022.102375. Epub 2022 Apr 28. Curr Opin Struct Biol. 2022. PMID: 35490650 Free PMC article. Review.
-
Structural Investigations of Protein-Lipid Complexes Using Neutron Scattering.Methods Mol Biol. 2019;2003:201-251. doi: 10.1007/978-1-4939-9512-7_11. Methods Mol Biol. 2019. PMID: 31218621 Review.
Cited by
-
Protein folding in the cell envelope of Escherichia coli.Nat Microbiol. 2016 Jul 26;1(8):16107. doi: 10.1038/nmicrobiol.2016.107. Nat Microbiol. 2016. PMID: 27573113 Review.
-
An integrative toolbox to unlock the structure and dynamics of protein-surfactant complexes.Nanoscale Adv. 2020 Jul 13;2(9):4011-4023. doi: 10.1039/d0na00194e. eCollection 2020 Sep 16. Nanoscale Adv. 2020. PMID: 36132802 Free PMC article.
-
Periplasmic Chaperones and Prolyl Isomerases.EcoSal Plus. 2018 Jul;8(1):10.1128/ecosalplus.ESP-0005-2018. doi: 10.1128/ecosalplus.ESP-0005-2018. EcoSal Plus. 2018. PMID: 29988001 Free PMC article. Review.
-
Evolving Escherichia coli Host Strains for Efficient Deuterium Labeling of Recombinant Proteins Using Sodium Pyruvate-d3.Int J Mol Sci. 2021 Sep 7;22(18):9678. doi: 10.3390/ijms22189678. Int J Mol Sci. 2021. PMID: 34575837 Free PMC article.
-
Outer membrane protein folding from an energy landscape perspective.BMC Biol. 2017 Dec 21;15(1):123. doi: 10.1186/s12915-017-0464-5. BMC Biol. 2017. PMID: 29268734 Free PMC article. Review.
References
-
- Bitto E, McKay DB. The periplasmic molecular chaperone protein SurA binds a peptide motif that is characteristic of integral outer membrane proteins. The Journal of Biological Chemistry. 2003;278:49316–49322. - PubMed
-
- Bulieris PV, Behrens S, Holst O, Kleinschmidt JH. Folding and insertion of the outer membrane protein OmpA is assisted by the chaperone Skp and by lipopolysaccharide. The Journal of Biological Chemistry. 2003;278:9092–9099. - PubMed
Publication types
MeSH terms
Substances
Grants and funding
LinkOut - more resources
Full Text Sources
Other Literature Sources
