

Gene expression profiling of asthma phenotypes demonstrates molecular signatures of atopy and asthma control
- PMID: 26792209
- PMCID: PMC4860055
- DOI: 10.1016/j.jaci.2015.09.058
Gene expression profiling of asthma phenotypes demonstrates molecular signatures of atopy and asthma control
Abstract
Background: Recent studies have used cluster analysis to identify phenotypic clusters of asthma with differences in clinical traits, as well as differences in response to therapy with anti-inflammatory medications. However, the correspondence between different phenotypic clusters and differences in the underlying molecular mechanisms of asthma pathogenesis remains unclear.
Objective: We sought to determine whether clinical differences among children with asthma in different phenotypic clusters corresponded to differences in levels of gene expression.
Methods: We explored differences in gene expression profiles of CD4(+) lymphocytes isolated from the peripheral blood of 299 young adult participants in the Childhood Asthma Management Program study. We obtained gene expression profiles from study subjects between 9 and 14 years of age after they participated in a randomized, controlled longitudinal study examining the effects of inhaled anti-inflammatory medications over a 48-month study period, and we evaluated the correspondence between our earlier phenotypic cluster analysis and subsequent follow-up clinical and molecular profiles.
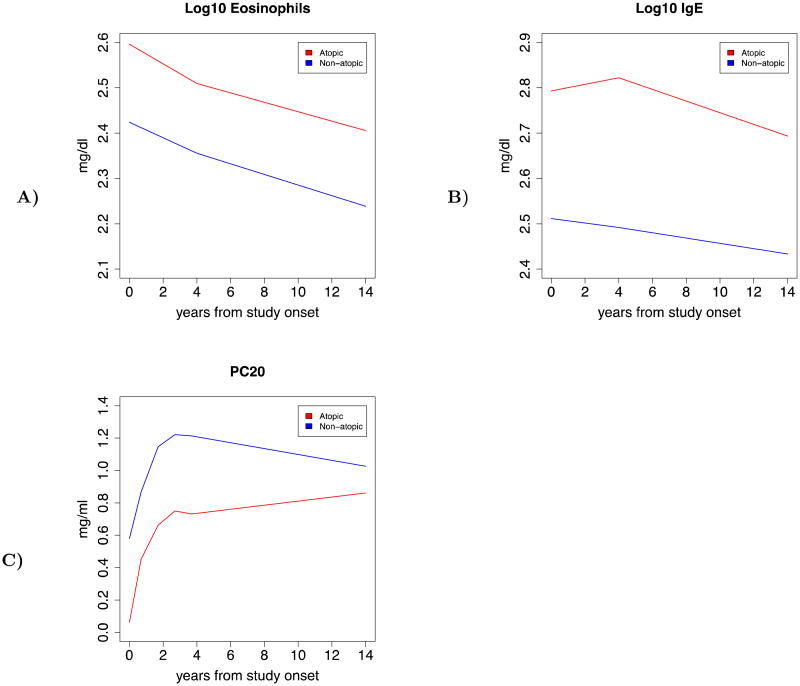
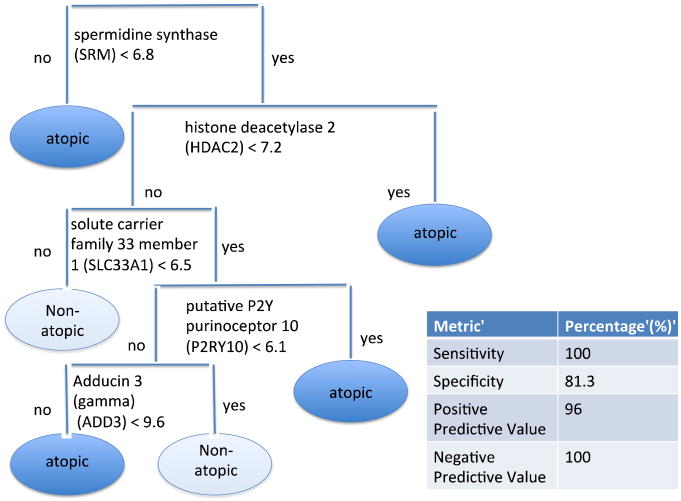
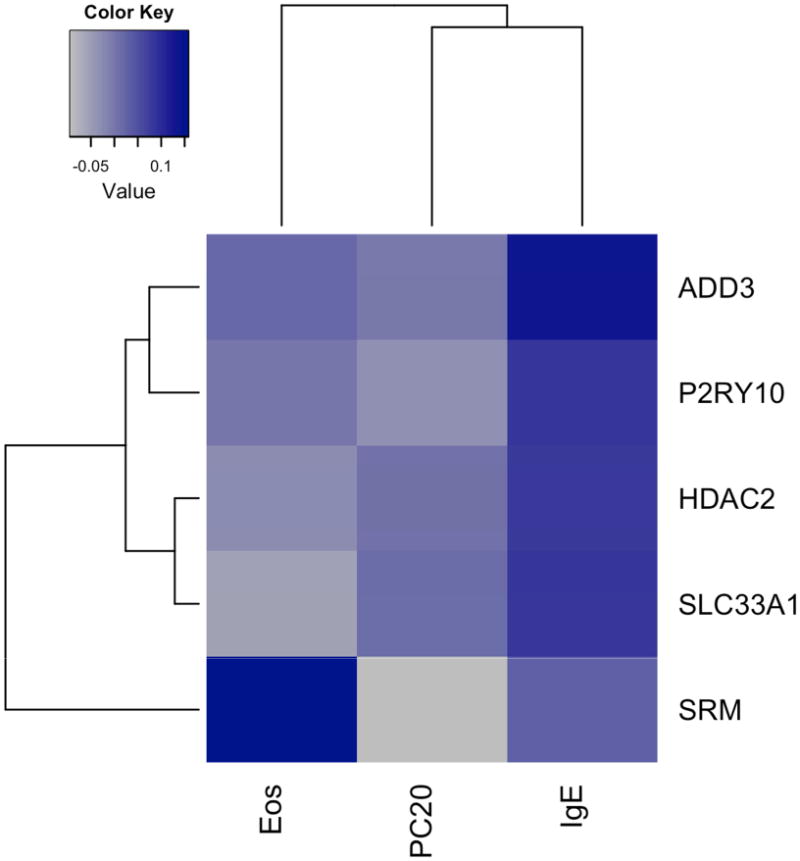
Results: We found that differences in clinical characteristics observed between subjects assigned to different phenotypic clusters persisted into young adulthood and that these clinical differences were associated with differences in gene expression patterns between subjects in different clusters. We identified a subset of genes associated with atopic status, validated the presence of an atopic signature among these genes in an independent cohort of asthmatic subjects, and identified the presence of common transcription factor binding sites corresponding to glucocorticoid receptor binding.
Conclusion: These findings suggest that phenotypic clusters are associated with differences in the underlying pathobiology of asthma. Further experiments are necessary to confirm these findings.
Keywords: Childhood asthma; asthma phenotypes; gene expression profiling; longitudinal study; microarray analysis.
Copyright © 2015 American Academy of Allergy, Asthma & Immunology. Published by Elsevier Inc. All rights reserved.
Conflict of interest statement
Figures

Similar articles
-
IL-5 and thromboxane A2 receptor gene polymorphisms are associated with decreased pulmonary function in Korean children with atopic asthma.J Allergy Clin Immunol. 2005 Apr;115(4):758-63. doi: 10.1016/j.jaci.2004.10.047. J Allergy Clin Immunol. 2005. PMID: 15805995
-
Role of gender and hormone-related events on IgE, atopy, and eosinophils in the Epidemiological Study on the Genetics and Environment of Asthma, bronchial hyperresponsiveness and atopy.J Allergy Clin Immunol. 2004 Sep;114(3):491-8. doi: 10.1016/j.jaci.2004.05.027. J Allergy Clin Immunol. 2004. PMID: 15356546
-
Allelic frequencies and patterns of single-nucleotide polymorphisms in candidate genes for asthma and atopy in Iceland.Am J Respir Crit Care Med. 2001 Dec 1;164(11):2036-44. doi: 10.1164/ajrccm.164.11.2101086. Am J Respir Crit Care Med. 2001. PMID: 11739132
-
Genetic profiles of transcriptomic clusters of childhood asthma determine specific severe subtype.Clin Exp Allergy. 2018 Sep;48(9):1164-1172. doi: 10.1111/cea.13175. Epub 2018 Jun 5. Clin Exp Allergy. 2018. PMID: 29758111
-
Asthma phenotypes in Niue Islanders.Respirology. 2004 Nov;9(4):521-7. doi: 10.1111/j.1440-1843.2004.00601.x. Respirology. 2004. PMID: 15612965
Cited by
-
Merged Affinity Network Association Clustering: Joint multi-omic/clinical clustering to identify disease endotypes.Cell Rep. 2021 Apr 13;35(2):108975. doi: 10.1016/j.celrep.2021.108975. Cell Rep. 2021. PMID: 33852839 Free PMC article.
-
Korean childhood asthma study (KAS): a prospective, observational cohort of Korean asthmatic children.BMC Pulm Med. 2019 Mar 15;19(1):64. doi: 10.1186/s12890-019-0829-3. BMC Pulm Med. 2019. PMID: 30876418 Free PMC article.
-
Immune-mediated genetic pathways resulting in pulmonary function impairment increase lung cancer susceptibility.Nat Commun. 2020 Jan 7;11(1):27. doi: 10.1038/s41467-019-13855-2. Nat Commun. 2020. PMID: 31911640 Free PMC article.
-
Metabo-Endotypes of Asthma Reveal Differences in Lung Function: Discovery and Validation in Two TOPMed Cohorts.Am J Respir Crit Care Med. 2022 Feb 1;205(3):288-299. doi: 10.1164/rccm.202105-1268OC. Am J Respir Crit Care Med. 2022. PMID: 34767496 Free PMC article.
-
Leveraging -omics for asthma endotyping.J Allergy Clin Immunol. 2019 Jul;144(1):13-23. doi: 10.1016/j.jaci.2019.05.015. J Allergy Clin Immunol. 2019. PMID: 31277743 Free PMC article. Review.
References
-
- Wenzel SE. Asthma phenotypes: the evolution from clinical to molecular approaches. Nat Med. 2012 May;18(5):716–25. - PubMed
-
- Fitzpatrick AM, Teague WG, Meyers DA, Peters SP, Li X, Li H, et al. Heterogeneity of severe asthma in childhood: confirmation by cluster analysis of children in the National Institutes of Health/National Heart, Lung, and Blood Institute Severe Asthma Research Program. J Allergy Clin Immunol. 2011 Feb;127(2):382–389. - PMC - PubMed
-
- Boudier A, Curjuric I, Basagana X, Hazgui H, Anto JM, Bousquet J, et al. Ten-year follow-up of cluster-based asthma phenotypes in adults. A pooled analysis of three cohorts. Am J Respir Crit Care Med. 2013 Sep;188(5):550–60. - PubMed
Publication types
MeSH terms
Substances
Grants and funding
LinkOut - more resources
Full Text Sources
Other Literature Sources
Medical
Research Materials
