

Human brain networks function in connectome-specific harmonic waves
- PMID: 26792267
- PMCID: PMC4735826
- DOI: 10.1038/ncomms10340
Human brain networks function in connectome-specific harmonic waves
Abstract
A key characteristic of human brain activity is coherent, spatially distributed oscillations forming behaviour-dependent brain networks. However, a fundamental principle underlying these networks remains unknown. Here we report that functional networks of the human brain are predicted by harmonic patterns, ubiquitous throughout nature, steered by the anatomy of the human cerebral cortex, the human connectome. We introduce a new technique extending the Fourier basis to the human connectome. In this new frequency-specific representation of cortical activity, that we call 'connectome harmonics', oscillatory networks of the human brain at rest match harmonic wave patterns of certain frequencies. We demonstrate a neural mechanism behind the self-organization of connectome harmonics with a continuous neural field model of excitatory-inhibitory interactions on the connectome. Remarkably, the critical relation between the neural field patterns and the delicate excitation-inhibition balance fits the neurophysiological changes observed during the loss and recovery of consciousness.
Figures


 at time t where
  ,
,  ,
,  and
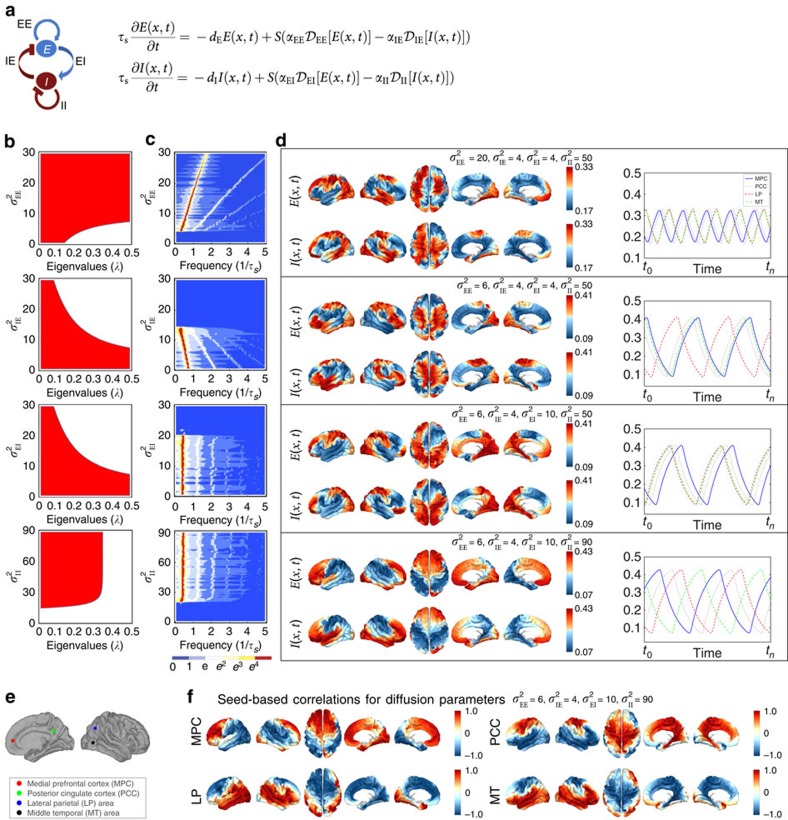
and  describe the diffusion processes of E and I activity acting on excitatory (EE, IE) and inhibitory (EI, II) neural populations and τs refers to the units of system time, that is, characteristic time scale. (b) Linear stability analysis of the neural field model in terms of connectome harmonics. The red regions correspond to the diffusion parameters in the phase space that algebraically satisfy the necessary condition for oscillations, that is, the critical Hopf regime, plotted as a function of the analysed diffusion parameter vertical axis and the eigenvalue of the connectome harmonic horizontal axis. (c) Power spectrum of the temporal oscillations in (a total of 267) numerical simulations averaged over all nodes. (d) Spatial pattern for an arbitrary time slice and the temporal profile of four seed locations shown in e. (f) Seed-based correlation analysis of the neural field patterns demonstrates the decoupling between the posterior and anterior midline nodes of the DMN for the same set of parameters leading to slow cortical oscillations.
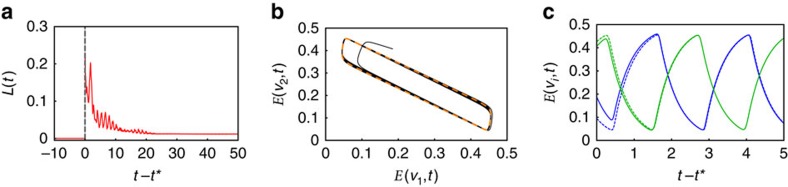
 ,
,  ,
,  and
and  ). (a) The distance measure L(t) versus the time from perturbation t−t* where t* denotes the time of perturbation by white noise. Before the perturbation L(t) is identical to 0. L(0) shows how far the perturbed system altered from the underlying oscillatory stable state. After perturbation, that is, when t−t*>0, L(t) approaches 0 showing the system is Lyapunov stable. (b) The convergence of the limit cycle; that is, excitatory activity of two non-adjacent nodes plotted over time, of the perturbed (black solid line) to unperturbed (orange dashed line) system. (c) The original (unperturbed) trajectory (dashed line) and the perturbed trajectory (solid line) for two sample vertices (green and blue lines) after perturbation t−t*∈[0, 5] unit time. The perturbed trajectory converges back to the original trajectory (with a small phase shift) demonstrating that the state corresponding to the original trajectory is Lyapunov stable to small perturbations.
References
Publication types
MeSH terms
Grants and funding
LinkOut - more resources
Full Text Sources
Other Literature Sources
Molecular Biology Databases
Miscellaneous
