

Structural asymmetry of the human cerebral cortex: Regional and between-subject variability of surface area, cortical thickness, and local gyrification
- PMID: 26792368
- PMCID: PMC4947520
- DOI: 10.1016/j.neuropsychologia.2016.01.012
Structural asymmetry of the human cerebral cortex: Regional and between-subject variability of surface area, cortical thickness, and local gyrification
Abstract
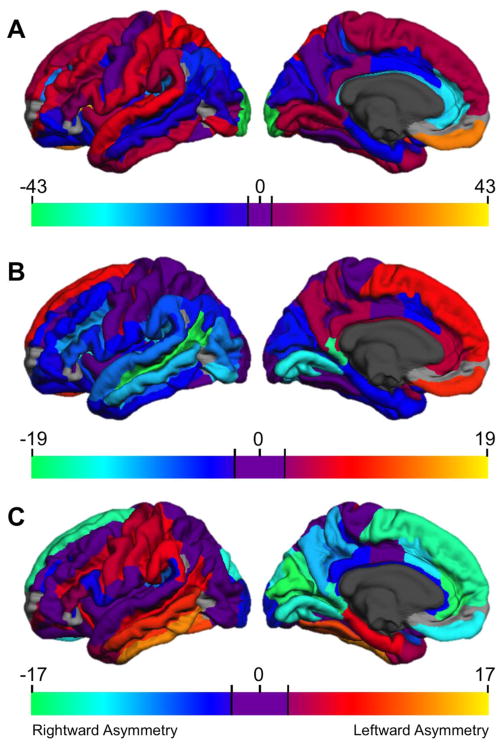
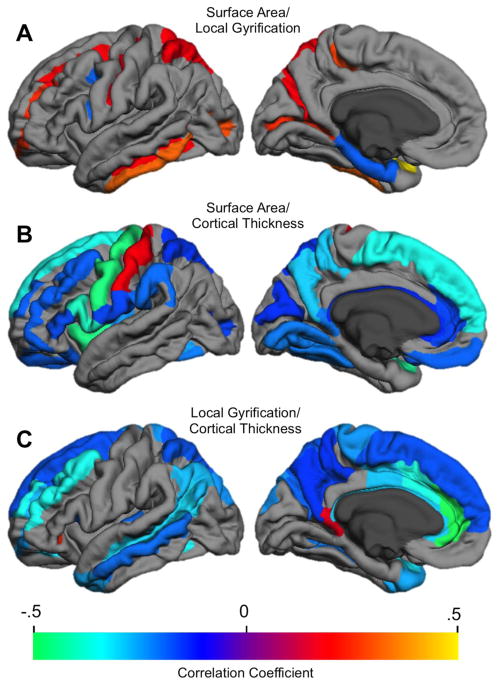
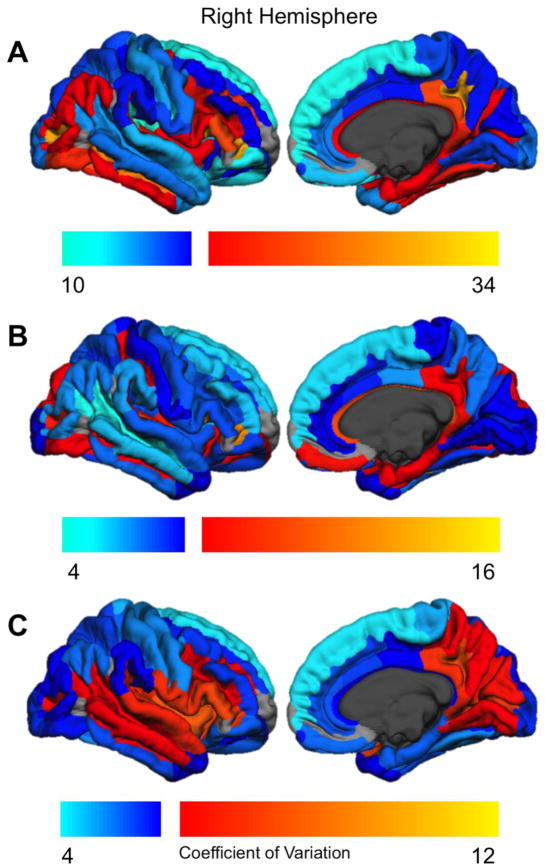
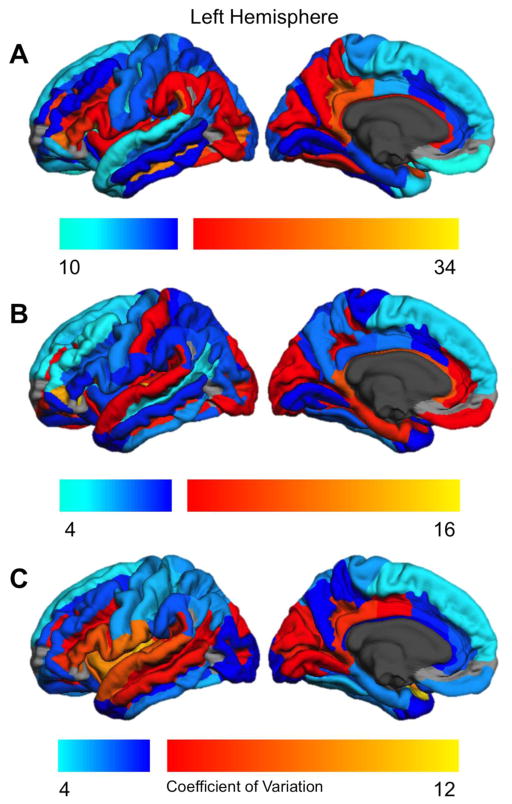
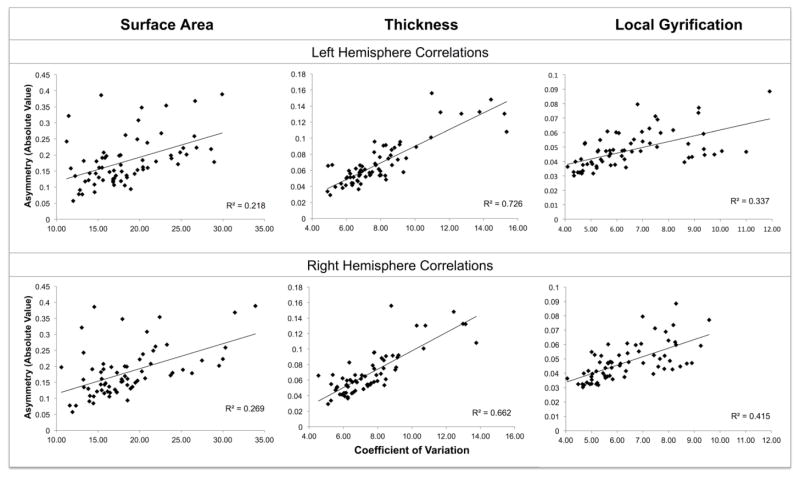
Structural asymmetry varies across individuals, brain regions, and metrics of cortical organization. The current study investigated regional differences in asymmetry of cortical surface area, thickness, and local gyrification, and the extent of between-subject variability in these metrics, in a sample of healthy young adults (N=200). Between-subject variability in cortical structure may provide a means to assess the extent of biological flexibility or constraint of brain regions, and we explored the potential influence of this variability on the phenotypic expression of structural asymmetry. The findings demonstrate that structural asymmetries are nearly ubiquitous across the cortex, with differing regional organization for the three cortical metrics. This implies that there are multiple, only partially overlapping, maps of structural asymmetry. The results further indicate that the degree of asymmetry of a brain region can be predicted by the extent of the region's between-subject variability. These findings provide evidence that reduced biological constraint promotes the expression of strong structural asymmetry.
Keywords: Cortical parcellation; Cortical thickness; Cortical variability; Local gyrification; Structural asymmetry; Surface area.
Copyright © 2016 Elsevier Ltd. All rights reserved.
Figures
References
-
- Amunts K, Schleicher A, Bürgel U, Mohlberg H, Uylings HBM, Zilles K. Broca’s region revisited: cytoarchitecture and inter-subject variability. Journal of Comparative Neurology. 1999;412:319–341. - PubMed
-
- Bedeian AG, Mossholder KW. On the use of the coefficient of variation as a measure of diversity. Organizational Research Methods. 2000;3:285–297.
-
- Benjamini Y, Hochberg Y. Controlling the false discovery rate: a practical and powerful approach to multiple testing. Journal of the Royal Statistical Society. Series B (Methodological) 1995:289–300.
MeSH terms
Grants and funding
LinkOut - more resources
Full Text Sources
Other Literature Sources
