

Review
doi: 10.1128/JVI.03375-14.
Dissecting the Molecular Mechanisms of the Tropism of Varicella-Zoster Virus for Human T Cells
Affiliations
- PMID: 26792747
- PMCID: PMC4794656
- DOI: 10.1128/JVI.03375-14
Item in Clipboard
Review
Dissecting the Molecular Mechanisms of the Tropism of Varicella-Zoster Virus for Human T Cells
J Virol.
.
Abstract
Studies of varicella-zoster virus (VZV) tropism for T cells support their role in viral transport to the skin during primary infection. Multiparametric single-cell mass cytometry demonstrates that, instead of preferentially infecting skin-homing T cells, VZV alters cell signaling and remodels surface proteins to enhance T cell skin trafficking. Viral proteins dispensable in skin, such as that encoded by open reading frame 66, are necessary in T cells. Interference with VZV T cell tropism may offer novel strategies for drug and vaccine design.
Copyright © 2016, American Society for Microbiology. All Rights Reserved.
Figures
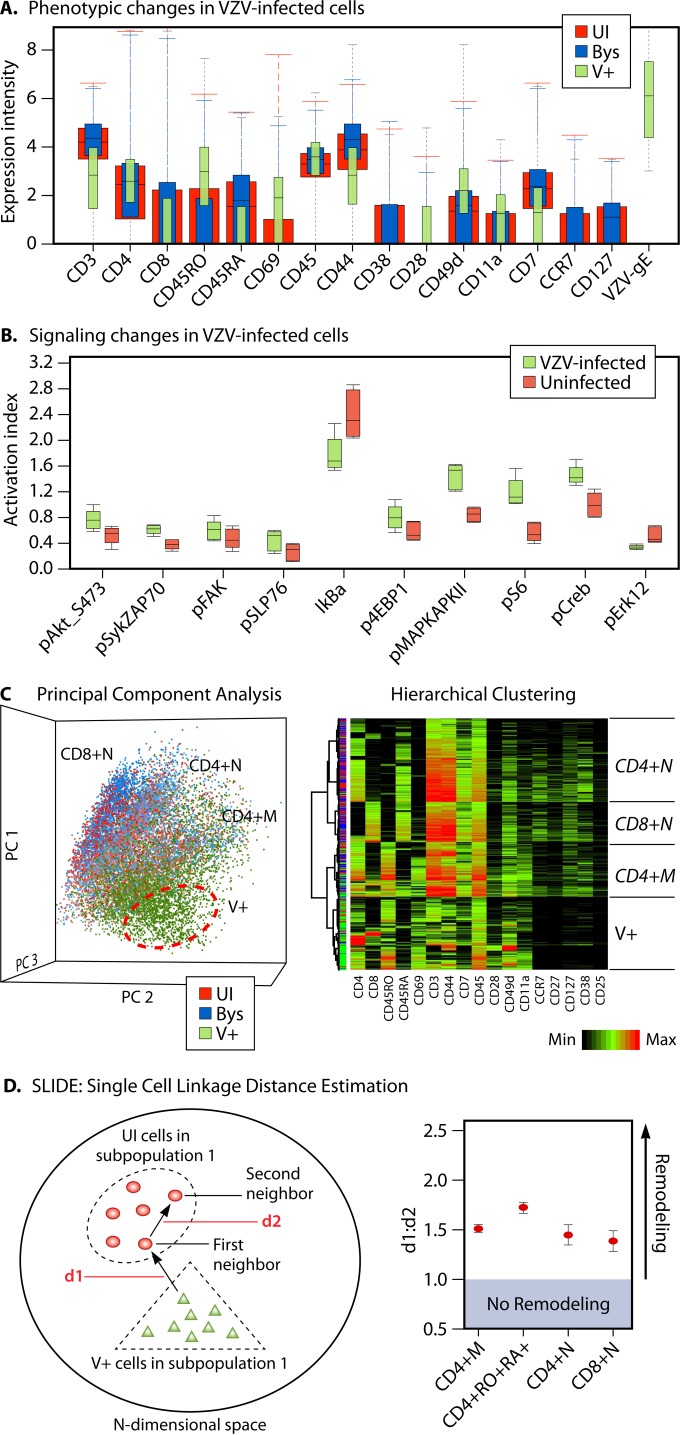
VZV T cell tropism. High-dimensional multiparametric analysis of single T cells by mass cytometry revealed that VZV infection induces bidirectional changes in surface and intracellular signaling proteins, enhancing properties that promote trafficking of infected T cells to skin sites of replication and lesion formation (12). (A) Boxplots showing the expression intensity of multiple cell surface proteins that were measured simultaneously in UI (red), Bys (blue), and V+ (green) T cells. In contrast to the UI T cells that were cocultured with UI HELF, the Bys T cells were exposed to VZV during coculture but remained UI, as determined by VZV gE expression. The error bars indicate the distribution of the data, and the black line inside each box indicates the median value of expression intensity. (Republished from reference with permission of the publisher.) (B) The boxplots shown denote the activation indexes (AIs) of the signaling proteins tested in VZV-infected T cells compared to the AI of UI T cells (n = 5). The AI was calculated as a product of the
intensity. Changes in the AI of signaling proteins were determined in different T cell subpopulations; the boxplots show those observed in CD4 memory T cells. (C) PCA (Partek Genomics Suite software) of UI, Bys, and V+ T cells revealed that the UI and Bys cells were broadly distributed into three predominant subpopulations—CD4 memory (CD4+ M), CD4 naive (CD4+ N), and CD8 naive (CD8+ N) as indicated (left side), while the VZV-infected T cells formed a distinct cell cloud. The PCA data are shown as a scatterplot where each dot represents a cell belonging to the UI (red), Bys (blue), or V+ (green) group. (Republished from reference with permission of the publisher.) Similar to the PCA data, hierarchical clustering (right side) also revealed three major subpopulations in the UI and Bys T cells, while the V+ cells clustered separately. In the heat map representation of the hierarchical clustering analysis, each row represents a cell and each column represents a protein. The intensity of expression of multiple proteins in a given cell can be visualized on the basis of the color scale; the dendrogram on the left indicates the distance or similarity between the cells (rows). (Republished from reference with permission of the publisher.) (D) A schematic diagram of the SLIDE algorithm is shown (left) along with a remodeling summary plot (right) that denotes the average d1/d2 ratio (y axis) observed in four different T cell subpopulations (x axis). Changes in the expression of phenotypic markers were quantified by SLIDE in each of the different CD4 and CD8 memory and naive subpopulations to provide mathematical evidence for remodeling of T cells by VZV. SLIDE revealed that a majority of the infected cells were remodeled to exhibit a skin-homing profile, thereby allowing migration of the infected cells to the skin.
References
Publication types
MeSH terms
Substances
Grants and funding
LinkOut - more resources
Full Text Sources
Other Literature Sources
Medical
