. 2016 Mar 15;27(6):1015-25.
doi: 10.1091/mbc.E15-08-0573. Epub 2016 Jan 20.

A robust platform for chemical genomics in bacterial systems

Affiliations

A robust platform for chemical genomics in bacterial systems

Shawn French et al. Mol Biol Cell. .

Abstract

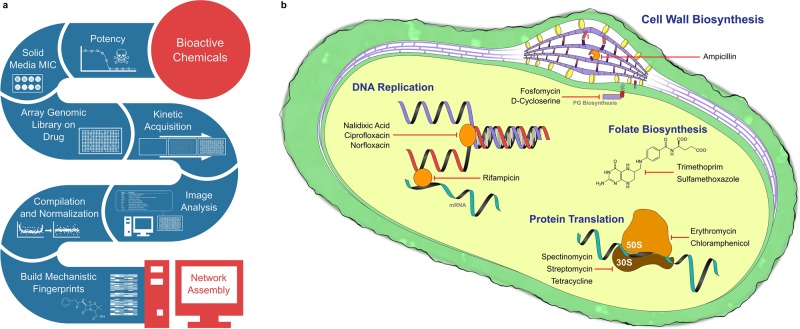
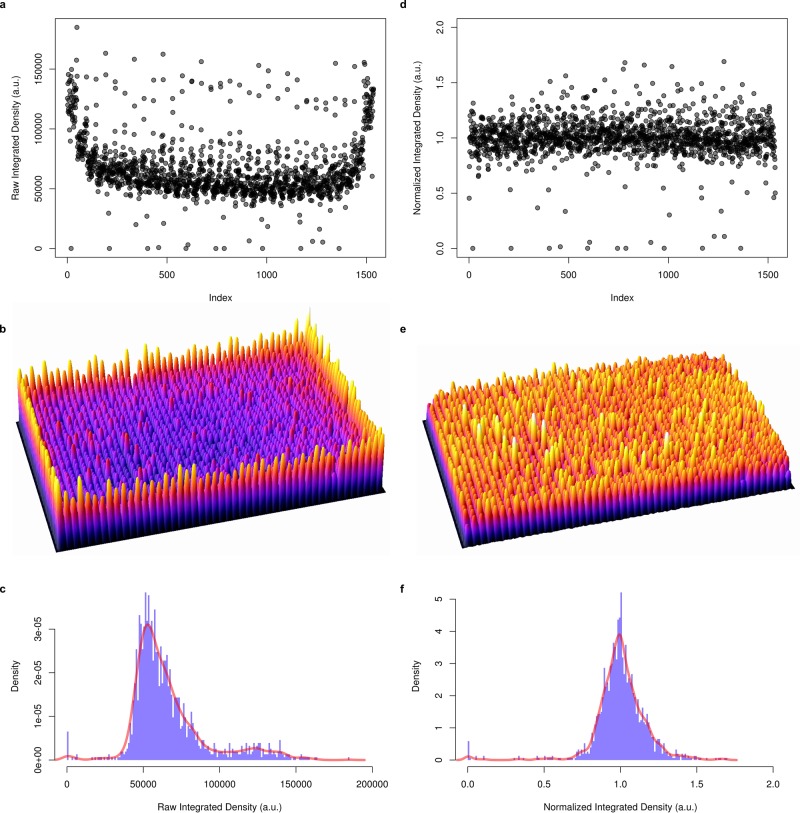
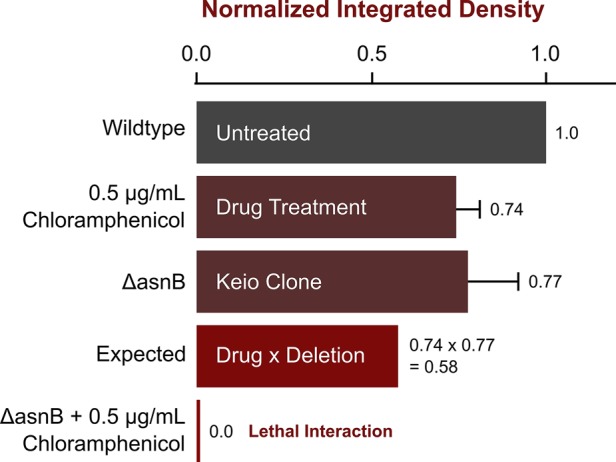
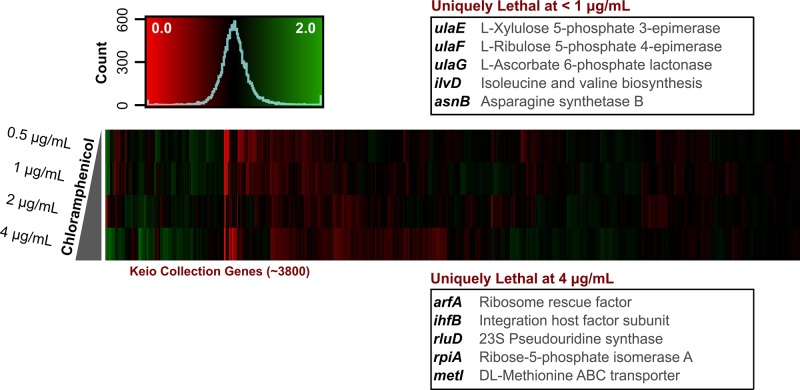
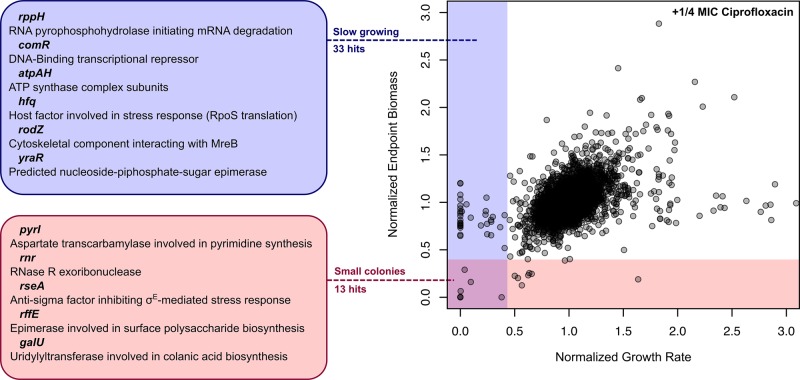
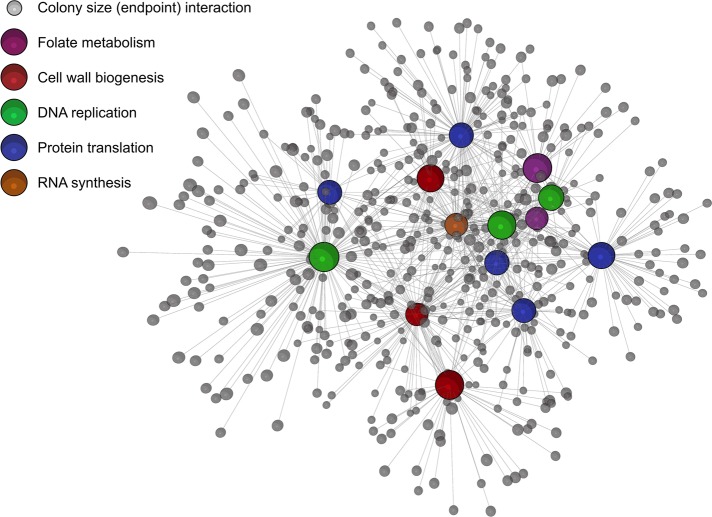
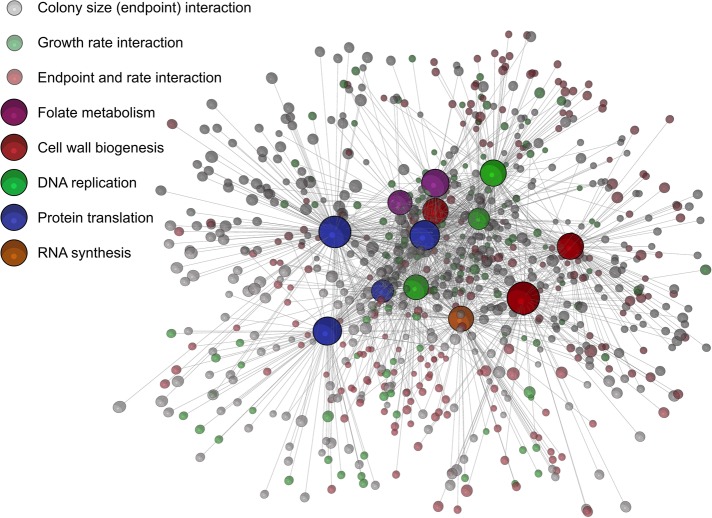
While genetic perturbation has been the conventional route to probing bacterial systems, small molecules are showing great promise as probes for cellular complexity. Indeed, systematic investigations of chemical-genetic interactions can provide new insights into cell networks and are often starting points for understanding the mechanism of action of novel chemical probes. We have developed a robust and sensitive platform for chemical-genomic investigations in bacteria. The approach monitors colony volume kinetically using transmissive scanning measurements, enabling acquisition of growth rates and conventional endpoint measurements. We found that chemical-genomic profiles were highly sensitive to concentration, necessitating careful selection of compound concentrations. Roughly 20,000,000 data points were collected for 15 different antibiotics. While 1052 chemical-genetic interactions were identified using the conventional endpoint biomass approach, adding interactions in growth rate resulted in 1564 interactions, a 50-200% increase depending on the drug, with many genes uncharacterized or poorly annotated. The chemical-genetic interaction maps generated from these data reveal common genes likely involved in multidrug resistance. Additionally, the maps identified deletion backgrounds exhibiting class-specific potentiation, revealing conceivable targets for combination approaches to drug discovery. This open platform is highly amenable to kinetic screening of any arrayable strain collection, be it prokaryotic or eukaryotic.


Figures

FIGURE 1:
FIGURE 1:
Chemical-genomics platform. (a) The workflow for the chemical-genomics platform. Bioactive chemicals (in this case antibiotics) are first tested for liquid and solid potency. Next they are supplemented into the agar medium of choice, onto which the genomic library is arrayed. Plates are imaged kinetically, and quantified in ImageJ. Finally, data are normalized, analyzed, and used to build a chemical-genomic network map. The spectrum of antibiotics chosen is outlined in b, illustrating the various cell processes targeted by the drugs chosen. Drugs targeting cell wall biogenesis, folate biosynthesis, protein translation, and DNA replication are all represented in our chosen panel of antibiotics. The chosen drugs probe a range of essential cell processes to validate our chemical-genomics platform.
FIGURE 2:
FIGURE 2:
Data normalization for edge effects. (a) Index plot depicting raw integrated density (colony volume) data for a 1536-well plate inoculated with 1536 Keio collection clones. The plate is organized according to column across the index plot, resulting in a familiar horseshoe appearance, due to spatial effects within the plate. These are especially clear in b, a three-dimensional plot of the raw data in a 1536-well plate. When plotted as a histogram (c), the data are heavily skewed, which makes statistical interpretation challenging. Our data normalization function turns the data shown in a into the index plot shown in d. The function divides individual colonies by the interquartile medians across rows and columns, removing the edge effects (e). Data are also then symmetrical about 1 (f), which is ideal for plate-to-plate comparisons, and downstream statistical analyses. The full R code is provided in the Supplementary Data, and the function is further explained in the Materials and Methods.
FIGURE 3:
FIGURE 3:
Multiplicative approach to identifying chemical-genetic interactions. We show here an example of how the multiplicative approach (Dixon et al., 2009) can be used to identify lethal or sick interactions in a chemical genomics pipeline. The integrated density values shown are in relation to the untreated wild-type E. coli K-12 BW25113 (Keio parent) strain. Drug-treated wild-type colonies (in this example, treated with 0.5 μg/ml chloramphenicol) show the effect of the drug on its own. Next the individual deletion background (ΔasnB in this case) is measured from a chemically untreated Keio collection plate. The multiplicative rule states that the expected size of this colony, assuming no interaction takes place, is the product of the single deletion and the chemical treatment of the wild type. The chemically treated deletion background is then compared with the expected value to determine whether there is a chemical-genetic interaction.
FIGURE 4:
FIGURE 4:
Chemical-genomic interactions are concentration dependent. This heat map illustrates the Keio collection probed by a concentration gradient of chloramphenicol. The data are symmetrical, ∼1, and show the enhancement (red) or suppression (green) of chloramphenicol by each deletion background. They demonstrate that, across multiple concentrations, suppression and enhancement profiles of drugs can be dose dependent. As the drug concentration is increased, more strains are sensitive to its effects. Interestingly, however, some strains are only sensitive to lower concentrations. Using a range of chloramphenicol concentrations as an example, we see, curiously, several reproducible metabolic genes sensitive to 0.5 μg/ml (1/32 MIC) concentrations of the drug. These disappear in higher concentrations of chloramphenicol, with some ribosome-related deletions becoming more apparent as the dose increases. The figure highlights the value of determining an accurate solid MIC in a chemical-genomics pipeline.
FIGURE 5:
FIGURE 5:
Analysis of growth rate finds more genetic enhancers of antibiotic action than endpoint biomass measurement. The figure shows a general example of conventional endpoint biomass values plotted against growth rate, with both measures compared with their expected values based on the multiplicative rule. Shown here are Keio collection deletion strains growing on 1/4 MIC inhibitory concentrations of the DNA replication drug ciprofloxacin. This plot separates strains with smaller colony sizes and slow growth rates, seen in the lower-left quadrant of the plot, from strains with average colony size but with slower growth. Screening for growth rate is much more sensitive than screening for endpoint biomass alone, yielding many more interactions. This gives a much more thorough glimpse into chemical-genetic interactions for a compound of interest that are not necessarily lethal or static in nature.
FIGURE 6:
FIGURE 6:
Escherichia coli chemical-genomic interaction map based on endpoint biomass. Interactions are shown, for the panel of antibiotics chosen at 1/4 MICs, with the E. coli Keio deletion collection. Interactions describe sick or lethal enhancement of each antibiotic probe and are based on the 2.5σ cutoff described in the Materials and Methods. The network was prepared using BioLayout3D, with major nodes for antibiotic classes annotated in the legend. Genes common across chemicals are easily identified in this manner (such as ubiG, rpoS, and nuoB), as are drug-sensitive strains within each particular drug class. The network is displayed as an edge-weighted force-directed Fruchterman-Reingold layout and can be further mined in BioLayout3D.
FIGURE 7:
FIGURE 7:
Chemical-genetic interaction map that combines drug sensitivities in biomass accumulation with sensitivities in growth rate for the Keio collection against our panel of antibiotics. Nodes representing conventional endpoint biomass sensitivities are shown in gray, nodes representing slow-growing strains are shown in green, and interactions in both are shown in red. Interactions for both phenotypes are defined in the Materials and Methods. Interestingly, there are ∼50% more unique interactions in the combined map than in the endpoint map shown in Figure 6. The network is displayed in the same manner as in Figure 6, as an edge-weighted force-directed Fruchterman-Reingold layout.

References

    1. Baba T, Ara T, Hasegawa M, Takai Y, Okumura Y, Baba M, Datsenko KA, Tomita M, Wanner BL, Mori H. Construction of Escherichia coli K-12 in-frame, single-gene knockout mutants: the Keio collection. Mol Syst Biol. 2006;2:2006.0008. - PMC - PubMed
    1. Baryshnikova A, Costanzo M, Kim Y, Ding H, Koh J, Toufighi K, Youn J-Y, Ou J, Luis B-JS, Bandyopadhyay S, et al. Quantitative analysis of fitness and genetic interactions in yeast on a genome scale. Nat Methods. 2010;7:1017–1024. - PMC - PubMed
    1. Bianchi AA, Baneyx F. Hyperosmotic shock induces the sigma32 and sigmaE stress regulons of Escherichia coli. Mol Microbiol. 1999;34:1029–1038. - PubMed
    1. Brideau C, Gunter B, Pikounis B, Liaw A. Improved statistical methods for hit selection in high-throughput screening. J Biomol Screen. 2003;8:634–647. - PubMed
    1. Brochado AR, Typas A. High-throughput approaches to understanding gene function and mapping network architecture in bacteria. Curr Opin Microbiol. 2013;16:199–206. - PubMed

Publication types

MeSH terms

Substances