. 2016 Apr;14(4):324-31.
doi: 10.1158/1541-7786.MCR-15-0472. Epub 2016 Jan 20.

BET Bromodomain Inhibitors Enhance Efficacy and Disrupt Resistance to AR Antagonists in the Treatment of Prostate Cancer

Affiliations

BET Bromodomain Inhibitors Enhance Efficacy and Disrupt Resistance to AR Antagonists in the Treatment of Prostate Cancer

Irfan A Asangani et al. Mol Cancer Res. 2016 Apr.

Abstract

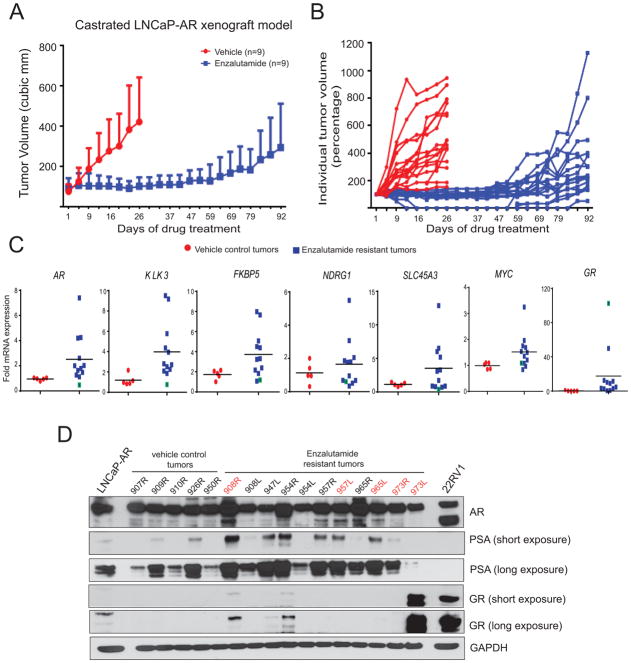
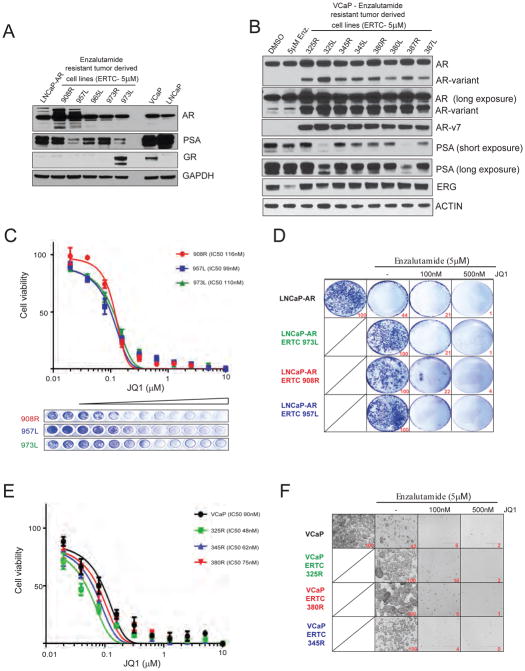
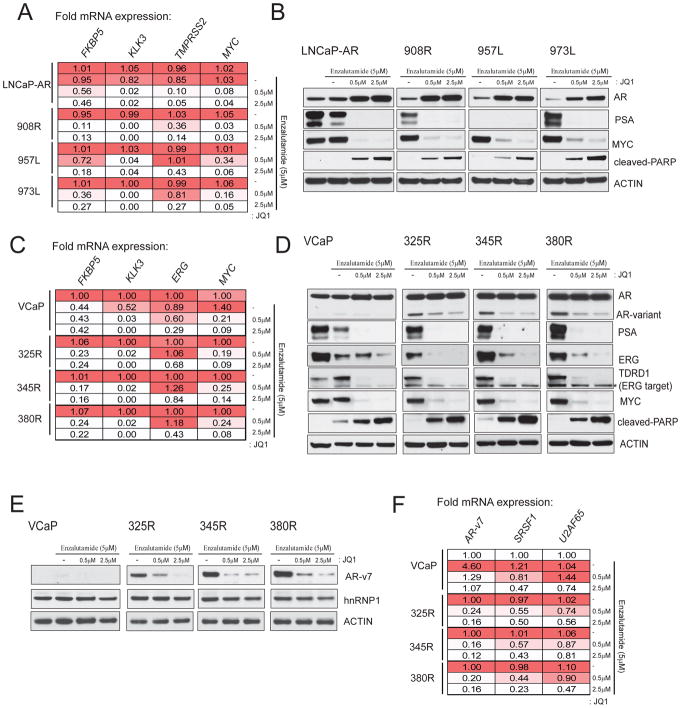
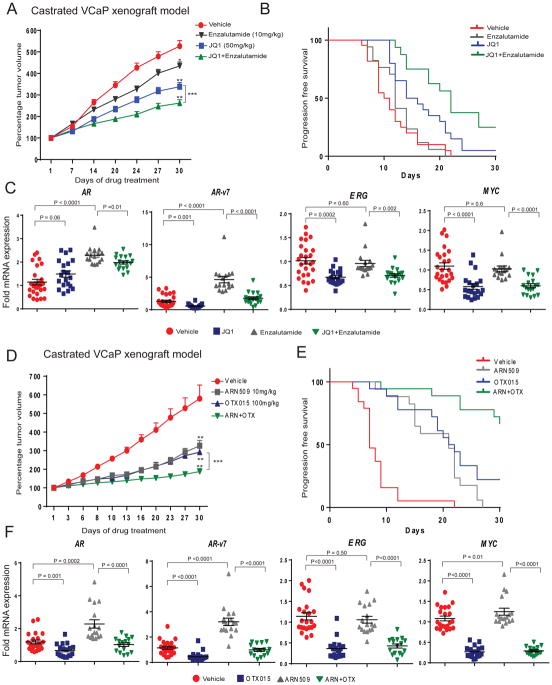
Next-generation antiandrogen therapies, such as enzalutamide and abiraterone, have had a profound impact on the management of metastatic castration-resistant prostate cancer (mCRPC). However, mCRPC patients invariably develop resistance to these agents. Here, a series of clonal cell lines were developed from enzalutamide-resistant prostate tumor xenografts to study the molecular mechanism of resistance and test their oncogenic potential under various treatment conditions. Androgen receptor (AR) signaling was maintained in these cell lines, which acquired potential resistance mechanisms, including expression of AR-variant 7 (AR-v7) and glucocorticoid receptor. BET bromodomain inhibitors were shown previously to attenuate AR signaling in mCRPC; here, we demonstrate the efficacy of bromodomain and extraterminal (BET) inhibitors in enzalutamide-resistant prostate cancer models. AR antagonists, enzalutamide, and ARN509 exhibit enhanced prostate tumor growth inhibition when combined with BET inhibitors, JQ1 and OTX015, respectively. Taken together, these data provide a compelling preclinical rationale to combine BET inhibitors with AR antagonists to subvert resistance mechanisms.

Implications: Therapeutic combinations of BET inhibitors and AR antagonists may enhance the clinical efficacy in the treatment of mCRPC.

Visual overview: http://mcr.aacrjournals.org/content/molcanres/14/4/324/F1.large.jpg


Conflict of interest statement

Disclosure of Potential Conflicts of Interest

A.M.C. and S.W. are co-founders of Oncofusion Therapeutics, which is developing novel BET bromodomain inhibitors. I.A.A. has served as consultant to Oncofusion Therapeutics.

Figures

Figure 1
Figure 1. Active AR signaling in enzalutamide-resistant xenograft tumors
A, LNCaP-AR cells were implanted subcutaneously in castrated mice and grown until tumors reached a size of approximately 100mm3. Xenografted mice were randomized and received vehicle or 10mg/kg enzalutamide, 5days a week. Mean tumor volume ±s.d. is shown. B, Individual tumors from A are shown. C, RT-qPCR analysis of AR and AR target genes in LNCaP-AR xenograft tumors Blue box with green boundary indicates tumor sample with outlier GR expression. D, Western blot analysis in tumor. Parental LNCaP-AR and 22RV1 were positive controls. Note tumor sample 973L with outlier GR protein and corresponding PSA levels. The sample number denotes the animal ID.
Figure 2
Figure 2. Enzalutamide resistant tumor-derived cells maintain BETi sensitivity
A, Western blot analysis with lysates from enzalutamide-resistant tumor-derived LNCaP-AR cell lines. B, Western blot analysis with lysates from enzalutamide-treated tumor-derived VCaP cell lines (n=8). VCaP cells treated with DMSO or 5μM enzalutamide served as control. Note the overexpression of full-length AR and AR-variant in enzalutamide-resistant VCaP derivatives. C, Cell viability curves for three independent enzalutamide-resistant LNCaP-AR cells treated with JQ1. Crystal violet imaging of the 96 well plate is shown. D, Colony formation assay; cells were cultured in the presence or absence of drugs as indicated for 14days followed by staining. Quantification is shown at bottom right. E, Cell viability curves for three independent enzalutamide-resistant VCaP cancer cells treated with JQ1. Parental VCaP cells served as control. F, Colony formation assay; cells were cultured in the presence or absence of drugs as indicated for 14days followed by imaging. Quantification (relative number of cells) is shown at bottom right.
Figure 3
Figure 3. BETi blocks AR signaling in enzalutamide resistant cells
A, RT-qPCR analysis of AR target genes in three independent LNCaP-AR ERTCs grown in 5uM enzalutamide, treated with JQ1 for 24hrs. Parental LNCaP-AR cells were treated with either enzalutamide alone and in combination with JQ1. Fold mRNA expression relative to the respective DMSO control is shown. The values are mean of 3 independent readings. B, Western blot analysis of indicated target proteins in the cells from A treated with JQ1 for 48hrs. Cleaved-PARP antibody was used to detect apoptosis. C, As in A with parental VCaP and three independent enzalutamide-resistant VCaP lines. D, As in B. Note the loss of AR-variant band but not the full-length AR band upon JQ1 treatment. TDRD1 is a direct target of ERG and was used as a control for ERG function. Star symbol - non-specific band. E, Western blot with AR-v7 specific antibody using the cell lysates from the same experiment. F, As in C with target specific primers.
Figure 4
Figure 4. BETi in combination with enzalutamide or ARN-509 demonstrates enhanced anti-tumor activity
A, Castrated mice bearing VCaP CRPC xenograft received vehicle or 10mg/kg enzalutamide or 50mg/kg JQ1 or enza./JQ1 combination as indicated 5days/week. Percentage tumor volume ±s.e.m. is shown. Statistical significance by two-tailed Student’s t-test * P=0.012; ** P<0.0001; *** P=0.005. B, The cumulative incidence plot depicting the percentage of tumors in each treatment group that have doubled in volume as a function of time. C, RT-qPCR analysis of indicated target gene expression in xenograft tumors. Relative fold expression with mean ±s.e.m is shown. D, As in A, except with 10mg/kg ARN-509 or 100mg/kg OTX-015 or ARN-509/OTX-015 combination. Percentage tumor volume ±s.e.m. is shown. Statistical significance by two-tailed Student’s t-test. * P=0.0045; ** P<0.001; *** P=0.0001, P=0.007. E, As in B. F, As in C.

References

    1. American Cancer Society. Cancer Facts and Figures 2015. 2015 http://wwwcancerorg/acs/groups/content/@editorial/documents/document/acs....
    1. Chen CD, Welsbie DS, Tran C, Baek SH, Chen R, Vessella R, et al. Molecular determinants of resistance to antiandrogen therapy. Nat Med. 2004;10(1):33–9. - PubMed
    1. Robinson D, Van Allen EM, Wu YM, Schultz N, Lonigro RJ, Mosquera JM, et al. Integrative clinical genomics of advanced prostate cancer. Cell. 2015;161(5):1215–28. - PMC - PubMed
    1. Visakorpi T, Hyytinen E, Koivisto P, Tanner M, Keinanen R, Palmberg C, et al. In vivo amplification of the androgen receptor gene and progression of human prostate cancer. Nat Genet. 1995;9(4):401–6. - PubMed
    1. de Bono JS, Logothetis CJ, Molina A, Fizazi K, North S, Chu L, et al. Abiraterone and increased survival in metastatic prostate cancer. N Engl J Med. 2011;364(21):1995–2005. - PMC - PubMed

Publication types

MeSH terms