

Differential dynamics of the mammalian mRNA and protein expression response to misfolding stress
- PMID: 26792871
- PMCID: PMC4731011
- DOI: 10.15252/msb.20156423
Differential dynamics of the mammalian mRNA and protein expression response to misfolding stress
Abstract
The relative importance of regulation at the mRNA versus protein level is subject to ongoing debate. To address this question in a dynamic system, we mapped proteomic and transcriptomic changes in mammalian cells responding to stress induced by dithiothreitol over 30 h. Specifically, we estimated the kinetic parameters for the synthesis and degradation of RNA and proteins, and deconvoluted the response patterns into common and unique to each regulatory level using a new statistical tool. Overall, the two regulatory levels were equally important, but differed in their impact on molecule concentrations. Both mRNA and protein changes peaked between two and eight hours, but mRNA expression fold changes were much smaller than those of the proteins. mRNA concentrations shifted in a transient, pulse-like pattern and returned to values close to pre-treatment levels by the end of the experiment. In contrast, protein concentrations switched only once and established a new steady state, consistent with the dominant role of protein regulation during misfolding stress. Finally, we generated hypotheses on specific regulatory modes for some genes.
Keywords: Central Dogma; ER stress; PECA; mammalian proteomics; mass spectrometry.
© 2016 The Authors. Published under the terms of the CC BY 4.0 license.
Figures
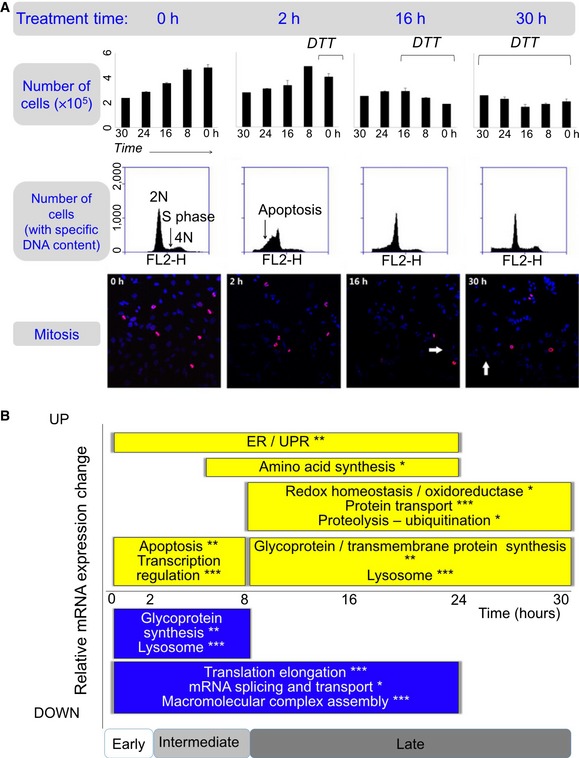
We estimated the degree of active cell division based on the cell density changes, the distribution of the DNA content, and the degree of active mitosis. Top panel: Bar graphs show numbers of live cells, with mean and standard deviations. Black lines, DTT treatment time. Middle panel: Quantitative analysis of cell cycle phases by flow cytometry using propidium iodide staining of DNA for cells treated with DTT for different periods of time. The 2N, 4N peaks and S‐phase plateau were observed in all time points, suggesting active cell division. Bottom panel: Immunofluorescence experiments show mitotic nuclei in red (anti‐phospho‐histone H3 (Ser10) antibody) and other nuclei in blue (DAPI). Mitotic nuclei were observed throughout the entire experiment. The ratio between the number of mitotic and all nuclei was similar among all the stress phases (not shown). White arrows, apoptotic nuclei. All experiments were performed in triplicate. The complete data are in Appendix Fig S3.
Summary of function enrichment of mRNA expression changes (FDR < 0.05, *P < 0.001, **P < 0.0001, and ***P < 0.00001). The corresponding expression data are shown in Appendix Fig S5. While some apoptosis occurred, remaining cells underwent intense unfolded protein and ER stress response.
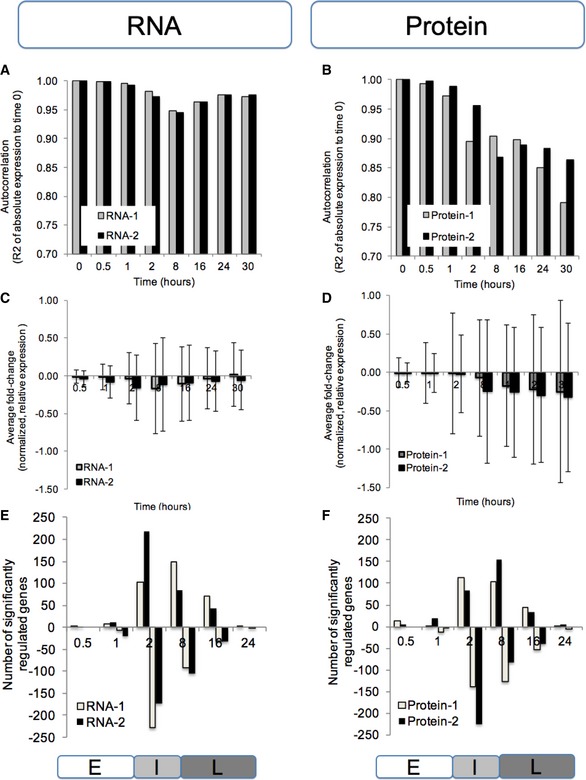
- A, B
Correlation (Pearson's R 2) between normalized, absolute expression values at time 0 and the respective time points.
- C, D
Average fold change (log base 10) and standard deviation of normalized, relative expression values.
- E, F
The number of significantly regulated genes as determined by PECA (FDR < 0.05). We summarized the CPS probabilities of each gene by choosing the maximum probability across the time points in each of the three phases, which allows us to characterize how expression regulation (rate ratio) has shifted phase by phase. Labels E, I, and L mark the early, intermediate, and late phase, respectively.
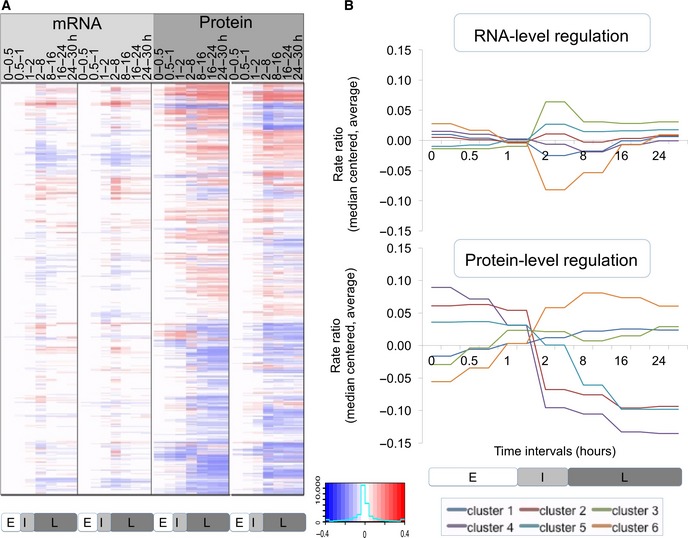
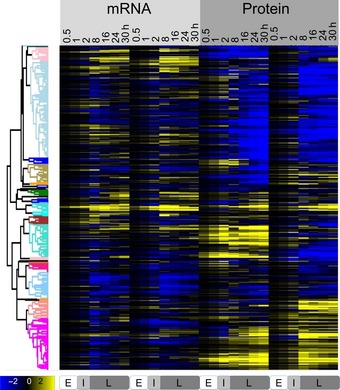
Heatmap of RNA and protein rate ratios as computed by PECA, shown for the two replicates.
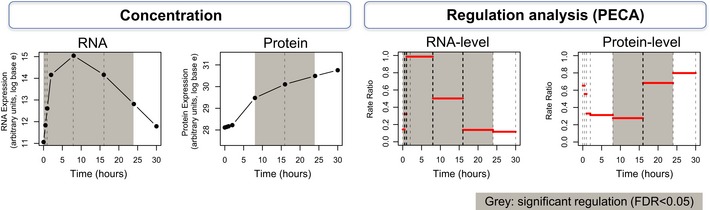
The average rate ratios across six major clusters for both RNA (top) and protein (bottom). RNA rate ratios show a spike in their changes during the intermediate phase, while protein rate ratios change only once around the two‐hour mark and remain at the new steady‐state level throughout the remainder of the experiment. The clusters are defined in Dataset EV1.
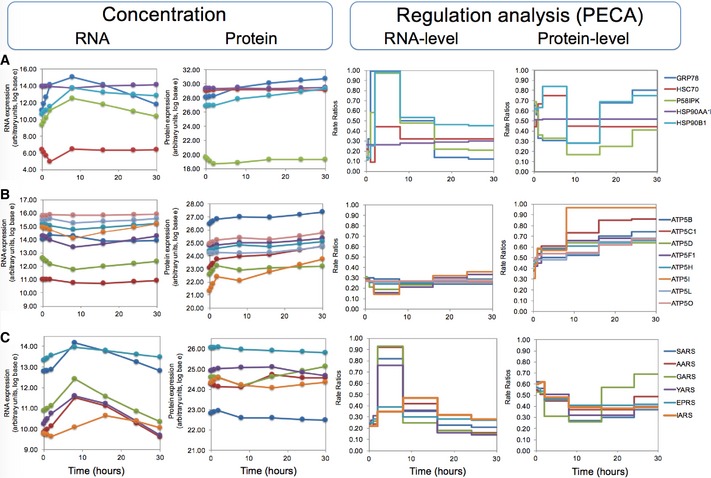
Five chaperones, including GRP78, with mixed expression patterns.
Eight subunits of ATP synthases observed in the experiment with mostly invariable RNA concentrations and increasing protein concentrations. PECA amplifies the hidden signal and identifies a significant protein‐level regulation.
Six aminoacyl‐tRNA synthetases whose mRNA concentration increases temporarily, but the protein concentrations remain largely constant. PECA deconvolutes the two opposing regulatory effects that act at the RNA and protein levels.
Comment in
-
The interdependence of transcript and protein abundance: new data--new complexities.Mol Syst Biol. 2016 Jan 20;12(1):856. doi: 10.15252/msb.20156720. Mol Syst Biol. 2016. PMID: 26792872 Free PMC article.
References
-
- Brewer JW, Bommiasamy H, Sriburi R, Jackowski S (2008) Membrane biogenesis induced by the unfolded protein response. FASEB J 22: 410.2
-
- Buchberger A, Bukau B, Sommer T (2010) Protein quality control in the cytosol and the endoplasmic reticulum: brothers in arms. Mol Cell 40: 238–252 - PubMed
Publication types
MeSH terms
Substances
Grants and funding
LinkOut - more resources
Full Text Sources
Other Literature Sources
Molecular Biology Databases
