. 2016 Mar;115(3):1542-55.
doi: 10.1152/jn.01037.2014. Epub 2016 Jan 20.

Receptive field properties of neurons in the macaque anterior intraparietal area

Affiliations

Receptive field properties of neurons in the macaque anterior intraparietal area

Maria C Romero et al. J Neurophysiol. 2016 Mar.

Abstract

Visual object information is necessary for grasping. In primates, the anterior intraparietal area (AIP) plays an essential role in visually guided grasping. Neurons in AIP encode features of objects, but no study has systematically investigated the receptive field (RF) of AIP neurons. We mapped the RF of posterior AIP (pAIP) neurons in the central visual field, using images of objects and small line fragments that evoked robust responses, together with less effective stimuli. The RF sizes we measured varied between 3°(2)and 90°(2), with the highest response either at the fixation point or at parafoveal positions. A large fraction of pAIP neurons showed nonuniform RFs, with multiple local maxima in both ipsilateral and contralateral hemifields. Moreover, the RF profile could depend strongly on the stimulus used to map the RF. Highly similar results were obtained with the smallest stimulus that evoked reliable responses (line fragments measuring 1-2°). The nonuniformity and dependence of the RF profile on the stimulus in pAIP were comparable to previous observations in the anterior part of the lateral intraparietal area (aLIP), but the average RF of pAIP neurons was located at the fovea whereas the average RF of aLIP neurons was located parafoveally. Thus nonuniformity and stimulus dependence of the RF may represent general RF properties of neurons in the dorsal visual stream involved in object analysis, which contrast markedly with those of neurons in the ventral visual stream.

Keywords: anterior intraparietal cortex; receptive field; stimulus dependence.


Figures

Fig. 1.
Fig. 1.
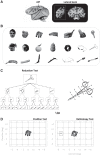
Methods. A: anatomical magnetic resonance image and lateral view of the macaque brain, indicating the reconstructed recording positions in posterior anterior intraparietal area (pAIP). Inside the dashed square, detail of the coronal section showing the microelectrode inserted into one of the recording positions. B: stimuli in the Search Test. C: Reduction Test. Example of the fragmentation performed on 1 of the stimuli (scissors). After extracting the outline of the image, we segmented the contour into, 4, 8, and 16 different fragments in order to determine the minimum effective feature evoking selectivity. D: Position and Retinotopy Tests. Images of objects and fragments were presented at each node of the grid and used to map the receptive field (RF) (area mapped: 12° × 8° around the fovea; 35 positions). In the Retinotopy Test, the fixation point was presented at the center of the display and at 5° in the ipsilateral hemifield.
Fig. 2.
Fig. 2.
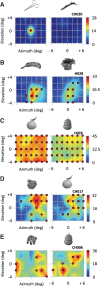
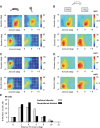
Example neurons in the Position Test (3° images). The graphs are 2-dimensional (2D) interpolated maps of the average responses to the preferred (left) and nonpreferred (right) images when tested with the 3° images of objects. Colors indicate the strength of the neural response (varying between 0 and the maximum response of the cell). The intersections on the grid lines indicate each of the 35 positions tested, where [0,0] is the central position (at the fixation point) and +6° azimuth is contralateral. Red circles indicate positions with a significant (P < 0.01, t-test) response to the stimulus. Note that the actual area of the visual field was larger than that illustrated in the figure because of the size of the images used (3°). This figure summarizes the 3 main RF profiles observed in pAIP. A and B: these example neurons show a uniform RF profile, exhibiting 1 unique local maxima either at the fovea (in A) or at 2° eccentricity (in B). C: example of a pAIP neuron with a large homogeneous RF profile. D and E: pAIP neurons showing a nonuniform RF, with multiple local maxima for both the preferred and nonpreferred images.
Fig. 3.
Fig. 3.
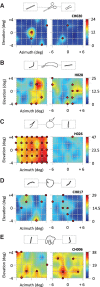
Example neurons in the Position Test with fragments. Interpolated maps showing the same neurons in Fig. 2 but now tested with the preferred (left) and nonpreferred (right) fragment as determined in the Reduction Test. A: example cell that preserved the RF structure across stimulus types. B: example cell showing a more nonuniform profile when tested with the fragments. C: pAIP neuron with a large homogeneous RF profile. D and E: example neurons showing nonuniform RFs, with multiple local maxima obtained for both the 3° and the fragment stimuli. Same conventions as in Fig. 2.
Fig. 4.
Fig. 4.
Analysis of the test-retest consistency in our pAIP population. A: example cell with a nonuniform RF; same as in Fig. 2D. B and C: RF profile of the same neuron when using the first (B) and second (C) halves of the trials. The 2D correlation coefficient between the 2 data sets was 0.77 for the preferred and 0.61 for the nonpreferred image. D–F: second example cell showing highly correlated RF profiles in the test-retest analysis (2D correlation coefficient = 0.81 for preferred and 0.79 for nonpreferred image). Conventions are the same as in Figs. 2 and 3.
Fig. 5.
Fig. 5.
Average RF. A: average normalized response of all neurons in our pAIP population (N = 81) when tested in the Position Test with the preferred and nonpreferred 3° images. B: average normalized response to the same preferred and nonpreferred 3° images for the subpopulation of pAIP neurons tested with fragments (N = 58). C: average normalized response of the subpopulation of pAIP neurons tested with the preferred and nonpreferred fragments (N = 58). Conventions are the same as in Figs. 2–4.
Fig. 6.
Fig. 6.
Spatial distribution of the pAIP RFs. Intersections on the grid lines indicate the 35 positions tested in the Position Test. The number of neurons showing their maximal response (global maxima) or a response statistically indistinguishable from the maximal response at each particular position is indicated by the radius of the gray circles.
Fig. 7.
Fig. 7.
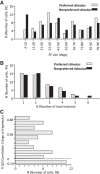
Population analysis. A: histogram of RF size tested with the preferred and nonpreferred 3° stimuli. B: histogram of the number of local maxima when tested with the preferred and nonpreferred 3° images. C: distribution of the 2D correlations between the RF tested with the preferred 3° images and the RF tested with the preferred fragment across our population of pAIP neurons.
Fig. 8.
Fig. 8.
Average difference (in spikes/s) between the RF map measured with the preferred image and the RF map measured with the nonpreferred shape, for all neurons with a nonuniform RF (N = 27). Same conventions as in previous figures.
Fig. 9.
Fig. 9.
Retinotopy Test. A: example neuron with a uniform RF profile when tested with a 3° image (preferred image, left; nonpreferred image, right). The global maximum of the RF is displaced into the ipsilateral hemifield when the fixation point is moved 5° ipsilaterally from the center. B: the same shift in the RF center is observed when the neuron is tested with 1° fragments. C and D: analyses of the test-retest consistency by comparing the first and second halves of the trials collected for this neuron when the monkey fixated in a direction 5° to the ipsilateral hemifield. The same analysis was repeated for the cell responses obtained with 3° images (C) and fragments (D). E: distribution of the estimated distance between the RF centers obtained in the Position and Retinotopy Tests for the same population of pAIP neurons (N = 59). Same conventions as in Fig. 2.
Fig. 10.
Fig. 10.
Graphic comparison of the spatiotopic or retinotopic behavior of neurons in our pAIP population. Yellow circles indicate the number of neurons with a global maximum at that position when the animal fixated a spot that appeared 5° to the left, whereas blue circles indicate the predicted number of neurons according to a spatiotopic (A) or a retinotopic (B) reference frame. As in Fig. 6, intersections on the grid lines indicate the 35 positions tested in the Position Test.

References

    1. Arcaro MJ, Pinsk MA, Li X, Kastner S. Visuotopic organization of macaque posterior parietal cortex: a functional magnetic resonance imaging study. J Neurosci 31: 2064–2078, 2011. - PMC - PubMed
    1. Baumann MA, Fluet MC, Scherberger H. Context-specific grasp movement representation in the macaque anterior intraparietal area. J Neurosci 29: 6436–6448, 2009. - PMC - PubMed
    1. Ben Hamed S, Duhamel JR, Bremmer F, Graf W. Representation of the visual field in the lateral intraparietal area of macaque monkeys: a quantitative receptive field analysis. Exp Brain Res 140: 127–144, 2001. - PubMed
    1. Ben Hamed S, Duhamel JR, Bremmer F, Graf W. Visual receptive field modulation in the lateral intraparietal area during attentive fixation and free gaze. Cereb Cortex 12: 234–245, 2002. - PubMed
    1. Castiello U. The neuroscience of grasping. Nat Rev Neurosci 6: 726–736, 2005. - PubMed

Publication types

LinkOut - more resources