

Solution structure of the Z-DNA binding domain of PKR-like protein kinase from Carassius auratus and quantitative analyses of the intermediate complex during B-Z transition
- PMID: 26792893
- PMCID: PMC4824103
- DOI: 10.1093/nar/gkw025
Solution structure of the Z-DNA binding domain of PKR-like protein kinase from Carassius auratus and quantitative analyses of the intermediate complex during B-Z transition
Abstract
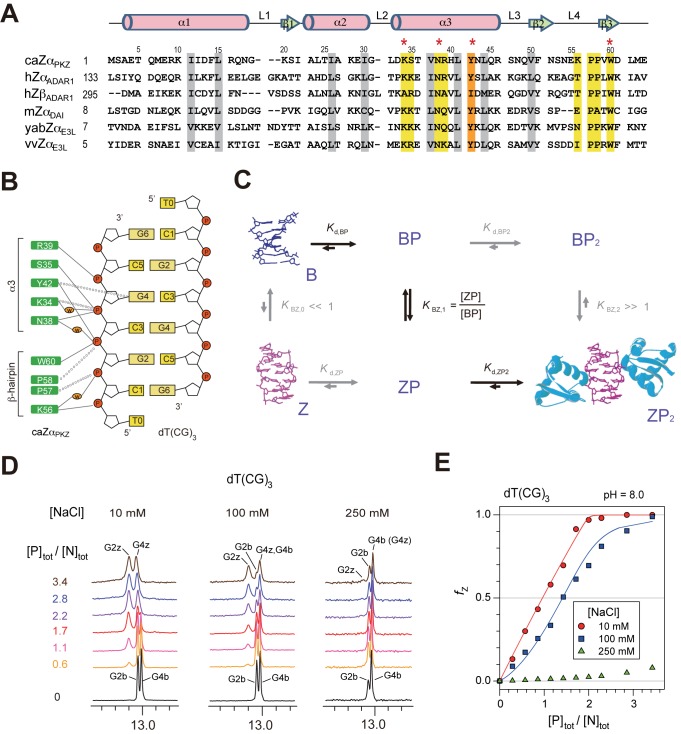
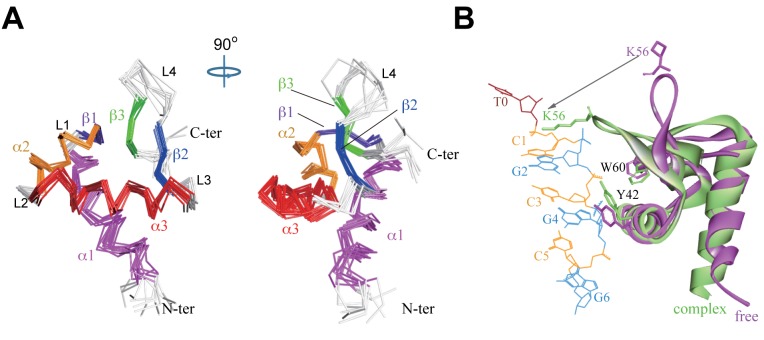
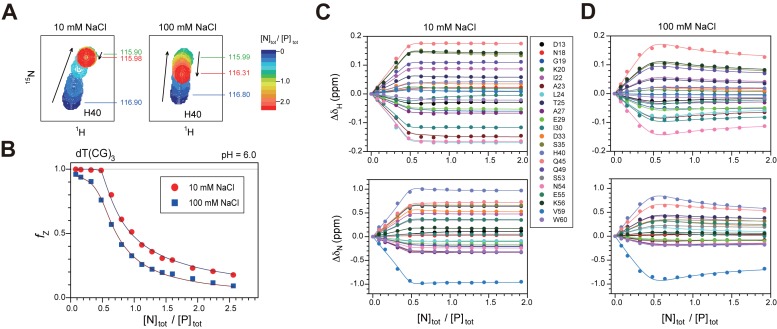
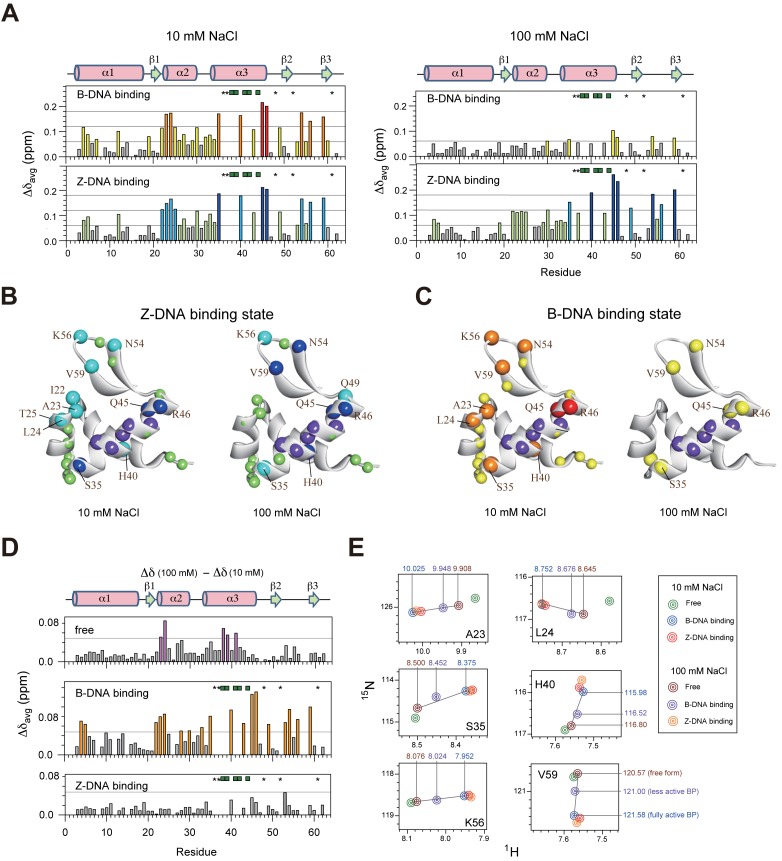
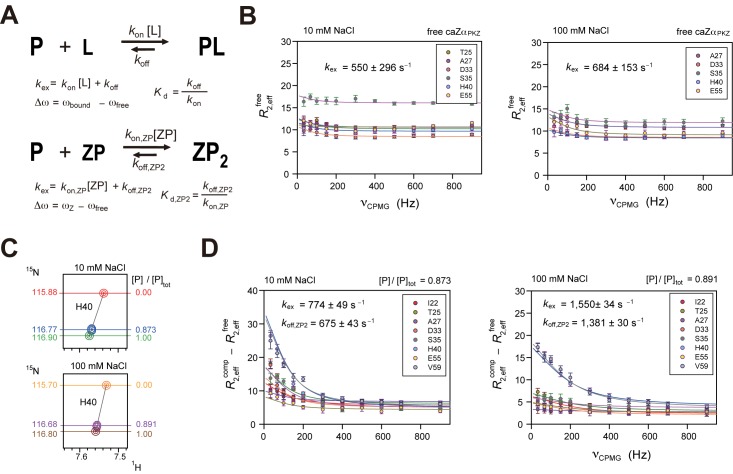
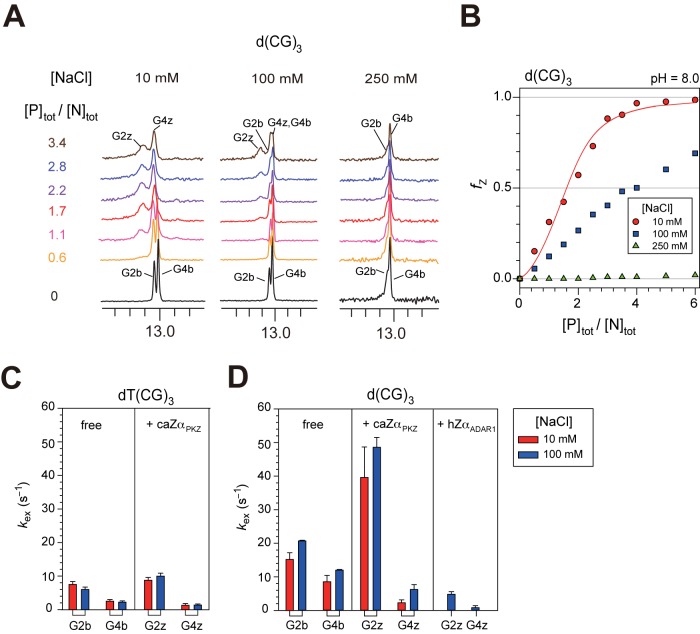
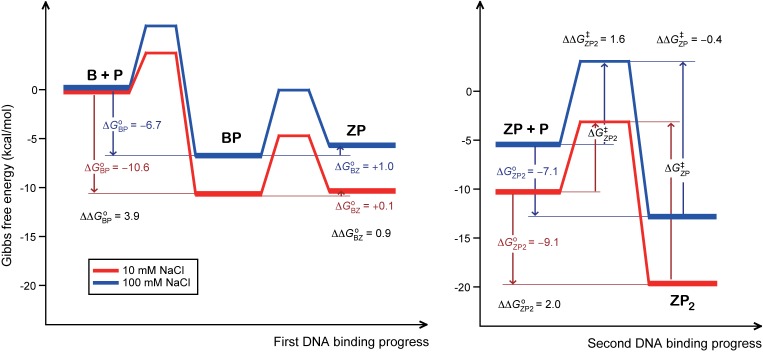
Z-DNA binding proteins (ZBPs) play important roles in RNA editing, innate immune response and viral infection. Structural and biophysical studies show that ZBPs initially form an intermediate complex with B-DNA for B-Z conversion. However, a comprehensive understanding of the mechanism of Z-DNA binding and B-Z transition is still lacking, due to the absence of structural information on the intermediate complex. Here, we report the solution structure of the Zα domain of the ZBP-containing protein kinase from Carassius auratus(caZαPKZ). We quantitatively determined the binding affinity of caZαPKZ for both B-DNA and Z-DNA and characterized its B-Z transition activity, which is modulated by varying the salt concentration. Our results suggest that the intermediate complex formed by caZαPKZ and B-DNA can be used as molecular ruler, to measure the degree to which DNA transitions to the Z isoform.
© The Author(s) 2016. Published by Oxford University Press on behalf of Nucleic Acids Research.
Figures
Similar articles
-
Distinct Z-DNA binding mode of a PKR-like protein kinase containing a Z-DNA binding domain (PKZ).Nucleic Acids Res. 2014 May;42(9):5937-48. doi: 10.1093/nar/gku189. Epub 2014 Mar 20. Nucleic Acids Res. 2014. PMID: 24682817 Free PMC article.
-
NMR elucidation of reduced B-Z transition activity of PKZ protein kinase at high NaCl concentration.Biochem Biophys Res Commun. 2017 Jan 8;482(2):335-340. doi: 10.1016/j.bbrc.2016.11.064. Epub 2016 Nov 14. Biochem Biophys Res Commun. 2017. PMID: 27856245
-
Thermodynamic Model for B-Z Transition of DNA Induced by Z-DNA Binding Proteins.Molecules. 2018 Oct 24;23(11):2748. doi: 10.3390/molecules23112748. Molecules. 2018. PMID: 30355979 Free PMC article. Review.
-
The Zα domain of fish PKZ converts DNA hairpin with d(GC)(n) inserts to Z-conformation.Acta Biochim Biophys Sin (Shanghai). 2013 Dec;45(12):1062-8. doi: 10.1093/abbs/gmt114. Epub 2013 Oct 10. Acta Biochim Biophys Sin (Shanghai). 2013. PMID: 24113090
-
Z-DNA binding proteins as targets for structure-based virtual screening.Curr Drug Targets. 2010 Mar;11(3):335-44. doi: 10.2174/138945010790711905. Curr Drug Targets. 2010. PMID: 20210758 Review.
Cited by
-
Oligonucleotides DNA containing 8-trifluoromethyl-2'-deoxyguanosine for observing Z-DNA structure.Nucleic Acids Res. 2020 Jul 27;48(13):7041-7051. doi: 10.1093/nar/gkaa505. Nucleic Acids Res. 2020. PMID: 32678885 Free PMC article.
-
Base-pair Opening Dynamics of Nucleic Acids in Relation to Their Biological Function.Comput Struct Biotechnol J. 2019 Jun 13;17:797-804. doi: 10.1016/j.csbj.2019.06.008. eCollection 2019. Comput Struct Biotechnol J. 2019. PMID: 31312417 Free PMC article. Review.
-
NMR Titration Studies in Z-DNA Dynamics.Methods Mol Biol. 2023;2651:69-83. doi: 10.1007/978-1-0716-3084-6_5. Methods Mol Biol. 2023. PMID: 36892760
-
2'-O-Methyl-8-methylguanosine as a Z-Form RNA Stabilizer for Structural and Functional Study of Z-RNA.Molecules. 2018 Oct 9;23(10):2572. doi: 10.3390/molecules23102572. Molecules. 2018. PMID: 30304782 Free PMC article.
-
Differential Structural Features of Two Mutant ADAR1p150 Zα Domains Associated with Aicardi-Goutières Syndrome.J Mol Biol. 2023 Apr 15;435(8):168040. doi: 10.1016/j.jmb.2023.168040. Epub 2023 Mar 7. J Mol Biol. 2023. PMID: 36889460 Free PMC article.
References
-
- Herbert A., Rich A. The biology of left-handed Z-DNA. J. Biol. Chem. 1996;271:11595–11598. - PubMed
-
- Herbert A., Rich A. Left-handed Z-DNA: structure and function. Genetica. 1999;106:37–47. - PubMed
-
- Rich A., Zhang S. Z-DNA: the long road to biological function. Nat. Rev. Genet. 2003;4:566–572. - PubMed
-
- Schwartz T., Behlke J., Lowenhaupt K., Heinemann U., Rich A. Structure of the DLM-1-Z-DNA complex reveals a conserved family of Z-DNA-binding proteins. Nat. Struct. Biol. 2001;8:761–765. - PubMed
Publication types
MeSH terms
Substances
LinkOut - more resources
Full Text Sources
Other Literature Sources
