. 2016 Feb 29;44(4):1746-59.
doi: 10.1093/nar/gkw006. Epub 2016 Jan 20.

Re-evaluation of G-quadruplex propensity with G4Hunter

Affiliations

Re-evaluation of G-quadruplex propensity with G4Hunter

Amina Bedrat et al. Nucleic Acids Res. .

Abstract

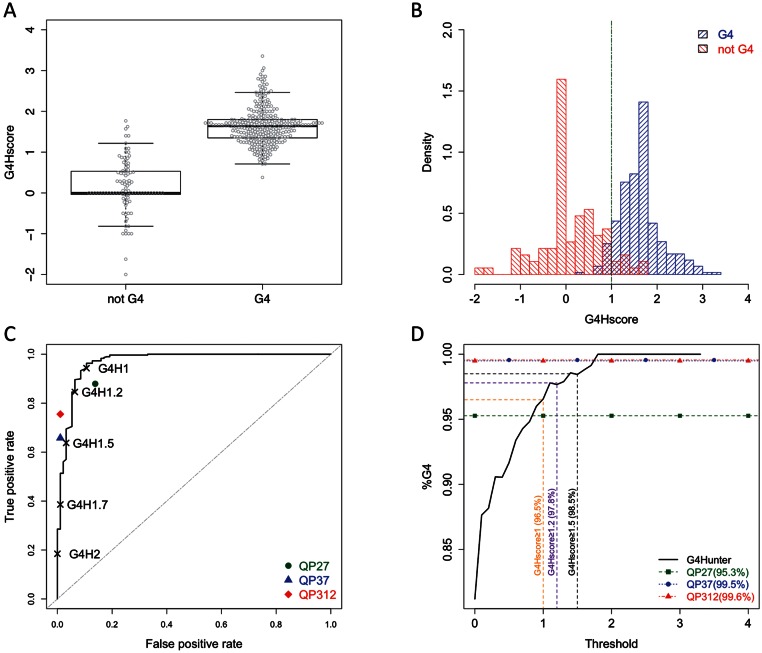
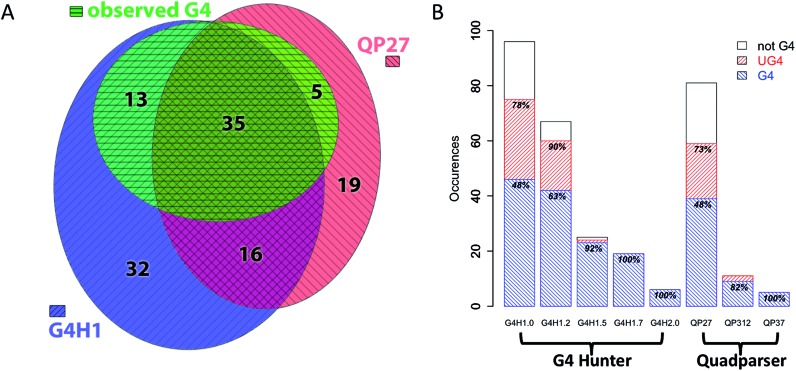
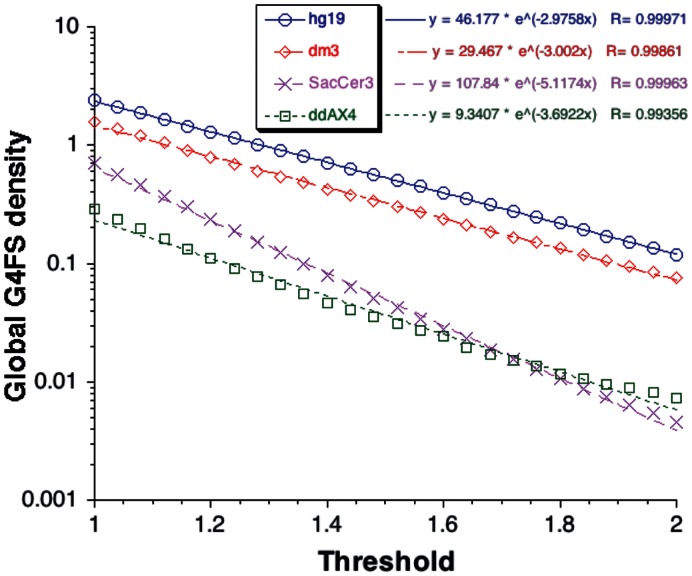
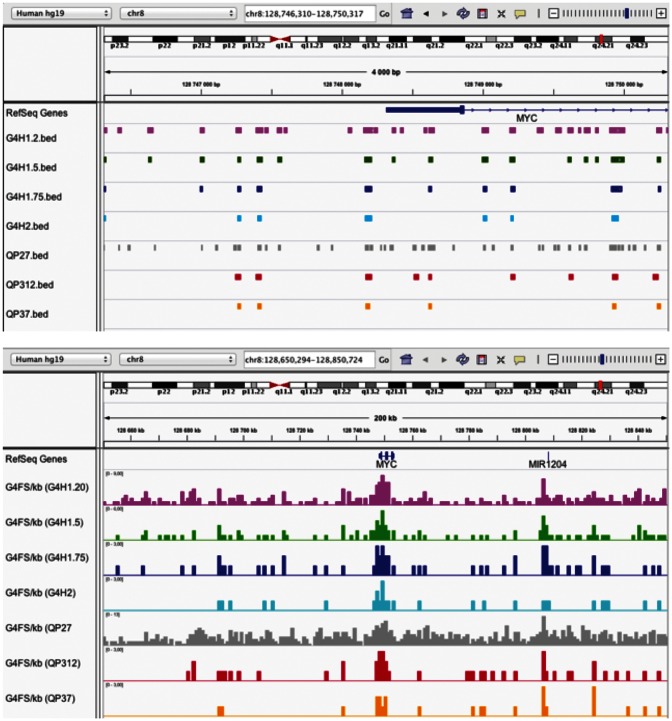
Critical evidence for the biological relevance of G-quadruplexes (G4) has recently been obtained in seminal studies performed in a variety of organisms. Four-stranded G-quadruplex DNA structures are promising drug targets as these non-canonical structures appear to be involved in a number of key biological processes. Given the growing interest for G4, accurate tools to predict G-quadruplex propensity of a given DNA or RNA sequence are needed. Several algorithms such as Quadparser predict quadruplex forming propensity. However, a number of studies have established that sequences that are not detected by these tools do form G4 structures (false negatives) and that other sequences predicted to form G4 structures do not (false positives). Here we report development and testing of a radically different algorithm, G4Hunter that takes into account G-richness and G-skewness of a given sequence and gives a quadruplex propensity score as output. To validate this model, we tested it on a large dataset of 392 published sequences and experimentally evaluated quadruplex forming potential of 209 sequences using a combination of biophysical methods to assess quadruplex formation in vitro. We experimentally validated the G4Hunter algorithm on a short complete genome, that of the human mitochondria (16.6 kb), because of its relatively high GC content and GC skewness as well as the biological relevance of these quadruplexes near instability hotspots. We then applied the algorithm to genomes of a number of species, including humans, allowing us to conclude that the number of sequences capable of forming stable quadruplexes (at least in vitro) in the human genome is significantly higher, by a factor of 2-10, than previously thought.


Figures

Figure 1.
Figure 1.
(A) Boxplot of the G4Hscore for the reference dataset. Opencircles represent the G4Hscore values for individual sequences belonging to eitherG4 or not-G4 classes. (B) Histogram of density distribution of the G4Hscores. Blue (right stripes) indicates G4 and red (left stripes) not-G4 forming classes, respectively. The dotted line indicates the value of G4Hscore for which more G4 than not-G4 sequences are found in this density histogram. (C) ROC curve for G4Hunter scores on the reference dataset. Black symbols represent the position of individual threshold values for G4Hunter. The symbols represent positions of the corresponding ROC values after applying Quadparser algorithm on the reference dataset with the following settings: runs of 2Gs and loop lengths between 1 and 7 (QP27, green dot), runs of 3Gs and loop lengths between 1 and 7 (QP37, blue triangle) and runs of 3Gs and loop lengths between 1 and 12 (QP312, red diamond). Random performing estimator would follow the dotted diagonal. (D) Precision versus threshold for G4Hunter. Fraction of sequence classified as G4 forming and which the G4Hscore is above the threshold in X-axis. Precision for the threshold 1, 1.2 and 1.5 are indicated with dotted vertical lines in orange, purple and black, respectively. Precision with QP27, QP37 and QP312 are indicated with the green squares, blue circles and red triangles lines respectively.
Figure 2.
Figure 2.
(A) Euler diagram representation of sequences from thehuman mitochondrial genome found by G4Hunter with a threshold of 1 (G4H1, blue, right stripes), sequences found by Quadparser (runs of 2Gs and loops length between 1 and 7, QP27, red, left stripes), and sequences experimentally demonstrated to form a G4 (green, horizontal stripes). Numbers indicate population of each subclass. (B) Number of sequences found by the different algorithms using various settings in the mitochondria genome (G4, in left striped blue, not-G4, in white and unstable G4 (UG4) in right striped red). The percentages in the blue bar indicate percentage for which G4 formation was experimentally confirmed. The % in the red bar indicate the fraction for which the conclusion of the biophysical test was G4 or UG4. The number of sequences for each list in this panel is the number of non-overlapping sequences.
Figure 3.
Figure 3.
Global G4FS density versus threshold for four whole genomes. The number of hits found by G4Hunter using a window size of 25 was computed at different thresholds from 1 to 2 for Homo sapiens (hg19, blue circles), Drosophila melanogaster (dm3, red diamonds), Saccharomyces cerevisiae (SacCer3, pink crosses) and Dictyostelium discoideum (ddAX4, green squares) genomes. Data for other genomes are shown as Supplementary Information. The densities of hits per kb are represented with respect to the threshold used and was fitted using an exponential fit. The fitted equations are provided with the same code as the genome.
Figure 4.
Figure 4.
Genome browser views of the G4FS found near the MYC promoter. G4FS on a 4-kb region (top) and G4FS density on a 200-kb region (bottom) calculated by G4Hunter with thresholds of 1.2 (pink), 1.5 (green), 1.75 (dark blue) and 2 (light blue). G4FS from QP27, QP312 and QP37 are represented in grey, red and orange, respectively.
Figure 5.
Figure 5.
Profiles of G4FS around TSSs identified using G4Hunter with thresholdsof 1.2, 1.5, 1.75 and 2 (upper left, upper right, lower left and lower right, respectively). The Y axis is the fraction of G4FS at the nucleotide level. For each position the number of times this nucleotide is found in a G4FS was divided by the number of TSS sequences (39 692). The blue dotted and red solid curves correspond to the G4FS found on the non-coding and coding strands, respectively.
Figure 6.
Figure 6.
Profiles of G4FS around the first exon/intron junction for transcriptsin the UCSC Known Genes list with G4Hunter thresholds of 1.2, 1.5, 1.75 and 2 (upper left, upper right, lower left and lower right, respectively). The number on the Y-axis, the fraction of G4FS, represents at the nucleotide level for each position the number of time this nucleotide is found in a G4FS divided by the number of junction regions (37 466). The dotted blue and solid red curves correspond to the G4FS found on the non-coding and coding strands, respectively.

References

    1. Watson J.D., Crick F.H. Genetical implications of the structure of deoxyribonucleic acid. Nature. 1953;171:964–967. - PubMed
    1. De Cian A., Lacroix L., Douarre C., Temime-Smaali N., Trentesaux C., Riou J.F., Mergny J.L. Targeting telomeres and telomerase. Biochimie. 2008;90:131–155. - PubMed
    1. Zimmermann M., Kibe T., Kabir S., de Lange T. TRF1 negotiates TTAGGG repeat-associated replication problems by recruiting the BLM helicase and the TPP1/POT1 repressor of ATR signaling. Genes Dev. 2014;28:2477–2491. - PMC - PubMed
    1. Siddiqui-Jain A., Grand C.L., Bearss D.J., Hurley L.H. Direct evidence for a G-quadruplex in a promoter region and its targeting with a small molecule to repress c-MYC transcription. PNAS. 2002;99:11593–11598. - PMC - PubMed
    1. Wieland M., Hartig J.S. RNA quadruplex-based modulation of gene expression. Chem. Biol. 2007;14:757–763. - PubMed

Publication types