

Spinal Muscular Atrophy Patient iPSC-Derived Motor Neurons Have Reduced Expression of Proteins Important in Neuronal Development
- PMID: 26793058
- PMCID: PMC4707261
- DOI: 10.3389/fncel.2015.00506
Spinal Muscular Atrophy Patient iPSC-Derived Motor Neurons Have Reduced Expression of Proteins Important in Neuronal Development
Abstract
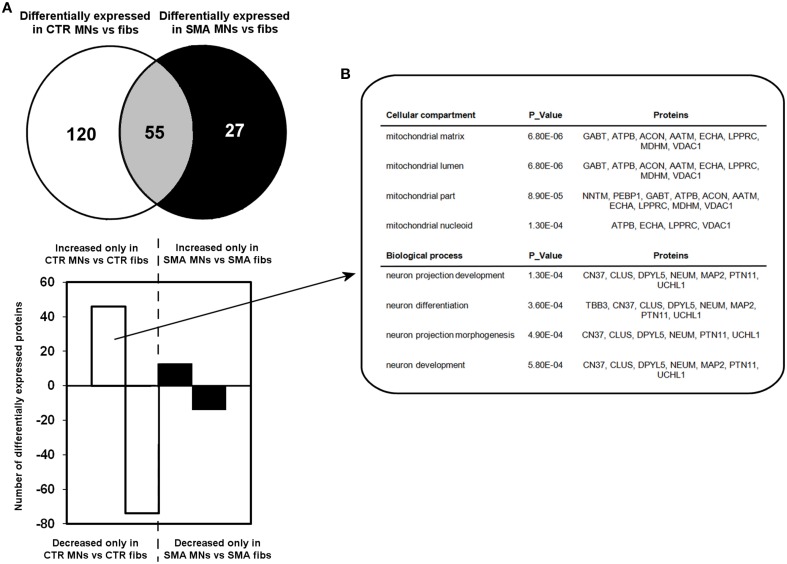
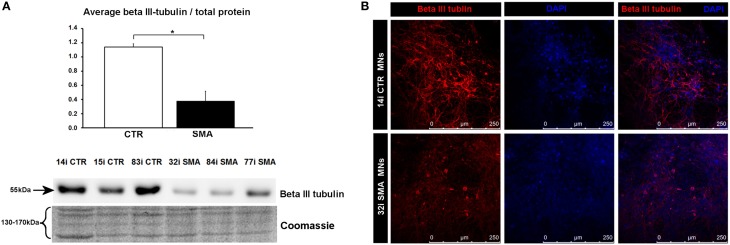
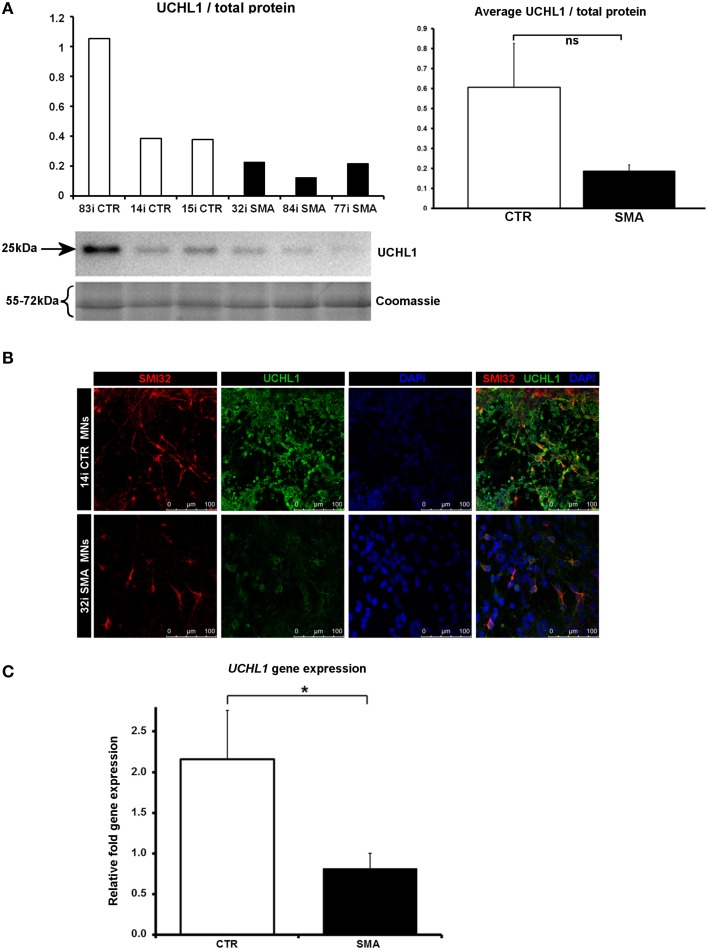
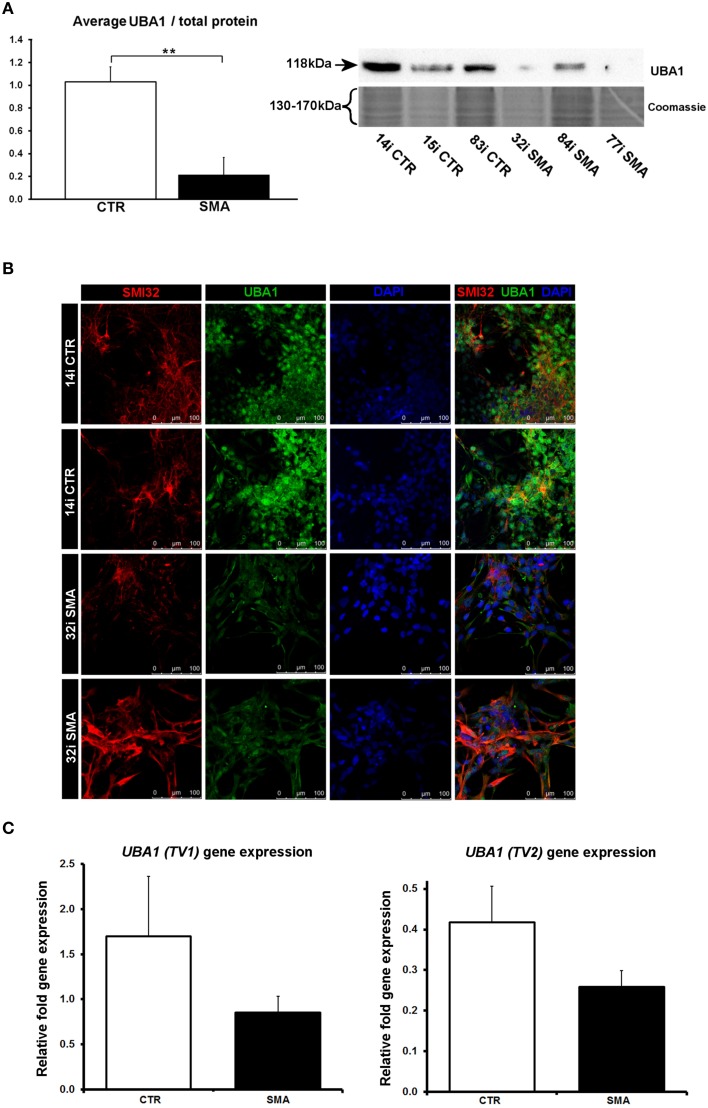
Spinal muscular atrophy (SMA) is an inherited neuromuscular disease primarily characterized by degeneration of spinal motor neurons, and caused by reduced levels of the SMN protein. Previous studies to understand the proteomic consequences of reduced SMN have mostly utilized patient fibroblasts and animal models. We have derived human motor neurons from type I SMA and healthy controls by creating their induced pluripotent stem cells (iPSCs). Quantitative mass spectrometry of these cells revealed increased expression of 63 proteins in control motor neurons compared to respective fibroblasts, whereas 30 proteins were increased in SMA motor neurons vs. their fibroblasts. Notably, UBA1 was significantly decreased in SMA motor neurons, supporting evidence for ubiquitin pathway defects. Subcellular distribution of UBA1 was predominantly cytoplasmic in SMA motor neurons in contrast to nuclear in control motor neurons; suggestive of neurodevelopmental abnormalities. Many of the proteins that were decreased in SMA motor neurons, including beta III-tubulin and UCHL1, were associated with neurodevelopment and differentiation. These neuron-specific consequences of SMN depletion were not evident in fibroblasts, highlighting the importance of iPSC technology. The proteomic profiles identified here provide a useful resource to explore the molecular consequences of reduced SMN in motor neurons, and for the identification of novel biomarker and therapeutic targets for SMA.
Keywords: Human iPSCs; Motor neuron; Neuronal Development; Proteomics; SMA; UBA1; UCHL1.
Figures


Similar articles
-
Increased levels of UCHL1 are a compensatory response to disrupted ubiquitin homeostasis in spinal muscular atrophy and do not represent a viable therapeutic target.Neuropathol Appl Neurobiol. 2014 Dec;40(7):873-87. doi: 10.1111/nan.12168. Neuropathol Appl Neurobiol. 2014. PMID: 25041530
-
Established Stem Cell Model of Spinal Muscular Atrophy Is Applicable in the Evaluation of the Efficacy of Thyrotropin-Releasing Hormone Analog.Stem Cells Transl Med. 2016 Feb;5(2):152-63. doi: 10.5966/sctm.2015-0059. Epub 2015 Dec 18. Stem Cells Transl Med. 2016. PMID: 26683872 Free PMC article.
-
Abnormal mitochondrial transport and morphology as early pathological changes in human models of spinal muscular atrophy.Dis Model Mech. 2016 Jan;9(1):39-49. doi: 10.1242/dmm.021766. Epub 2015 Nov 19. Dis Model Mech. 2016. PMID: 26586529 Free PMC article.
-
Commonality amid diversity: Multi-study proteomic identification of conserved disease mechanisms in spinal muscular atrophy.Neuromuscul Disord. 2016 Sep;26(9):560-9. doi: 10.1016/j.nmd.2016.06.004. Epub 2016 Jun 7. Neuromuscul Disord. 2016. PMID: 27460344 Review.
-
Pluripotent stem cell-based models of spinal muscular atrophy.Mol Cell Neurosci. 2015 Jan;64:44-50. doi: 10.1016/j.mcn.2014.12.005. Epub 2014 Dec 12. Mol Cell Neurosci. 2015. PMID: 25511182 Review.
Cited by
-
Ubiquitination Insight from Spinal Muscular Atrophy-From Pathogenesis to Therapy: A Muscle Perspective.Int J Mol Sci. 2024 Aug 13;25(16):8800. doi: 10.3390/ijms25168800. Int J Mol Sci. 2024. PMID: 39201486 Free PMC article. Review.
-
Life and death in the trash heap: The ubiquitin proteasome pathway and UCHL1 in brain aging, neurodegenerative disease and cerebral Ischemia.Ageing Res Rev. 2017 Mar;34:30-38. doi: 10.1016/j.arr.2016.09.011. Epub 2016 Oct 1. Ageing Res Rev. 2017. PMID: 27702698 Free PMC article. Review.
-
The role of survival motor neuron protein (SMN) in protein homeostasis.Cell Mol Life Sci. 2018 Nov;75(21):3877-3894. doi: 10.1007/s00018-018-2849-1. Epub 2018 Jun 5. Cell Mol Life Sci. 2018. PMID: 29872871 Free PMC article. Review.
-
Structural variations causing inherited peripheral neuropathies: A paradigm for understanding genomic organization, chromatin interactions, and gene dysregulation.Mol Genet Genomic Med. 2018 May;6(3):422-433. doi: 10.1002/mgg3.390. Epub 2018 Mar 23. Mol Genet Genomic Med. 2018. PMID: 29573232 Free PMC article. Review.
-
Advances in therapy for spinal muscular atrophy: promises and challenges.Nat Rev Neurol. 2018 Apr;14(4):214-224. doi: 10.1038/nrneurol.2018.4. Epub 2018 Feb 9. Nat Rev Neurol. 2018. PMID: 29422644 Review.
References
-
- Aghamaleky Sarvestany A., Hunter G., Tavendale A., Lamont D. J., Llavero Hurtado M., Graham L. C., et al. . (2014). Label-free quantitative proteomic profiling identifies disruption of ubiquitin homeostasis as a key driver of Schwann cell defects in spinal muscular atrophy. J. Proteome Res. 13, 4546–4557. 10.1021/pr500492j - DOI - PubMed
-
- Bilguvar K., Tyagi N. K., Ozkara C., Tuysuz B., Bakircioglu M., Choi M., et al. . (2013). Recessive loss of function of the neuronal ubiquitin hydrolase UCHL1 leads to early-onset progressive neurodegeneration. Proc. Natl. Acad. Sci. U.S.A. 110, 3489–3494. 10.1073/pnas.1222732110 - DOI - PMC - PubMed
-
- Bilican B., Serio A., Barmada S. J., Nishimura A. L., Sullivan G. J., Carrasco M., et al. . (2012). Mutant induced pluripotent stem cell lines recapitulate aspects of TDP-43 proteinopathies and reveal cell-specific vulnerability. Proc. Natl. Acad. Sci. U.S.A. 109, 5803–5808. 10.1073/pnas.1202922109 - DOI - PMC - PubMed
Grants and funding
LinkOut - more resources
Full Text Sources
Other Literature Sources
Research Materials
Miscellaneous