. 2016 Jan 11:6:360.
doi: 10.3389/fgene.2015.00360. eCollection 2015.

Milk Bottom-Up Proteomics: Method Optimization

Affiliations

Milk Bottom-Up Proteomics: Method Optimization

Delphine Vincent et al. Front Genet. .

Abstract

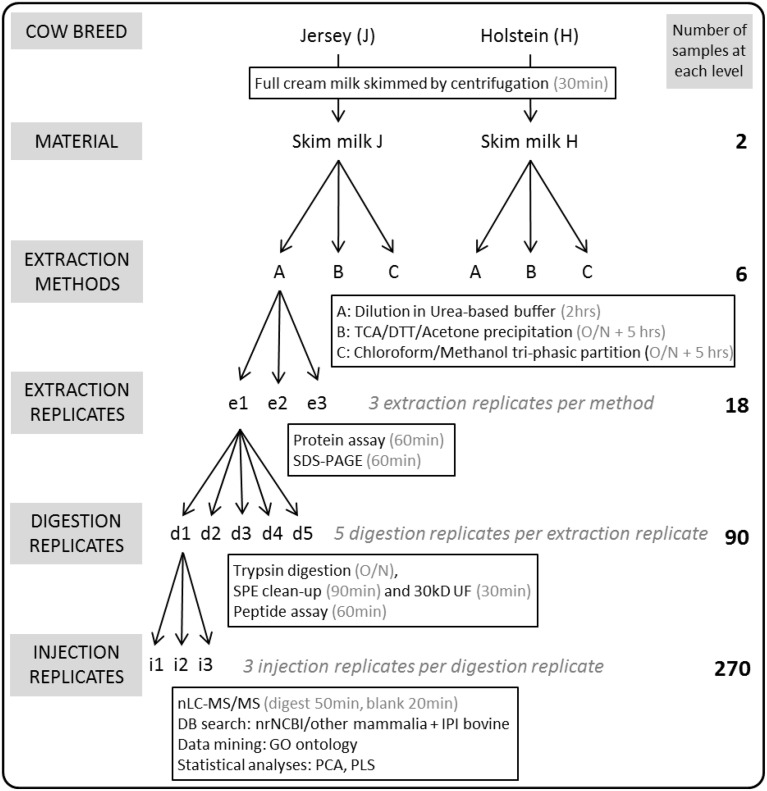
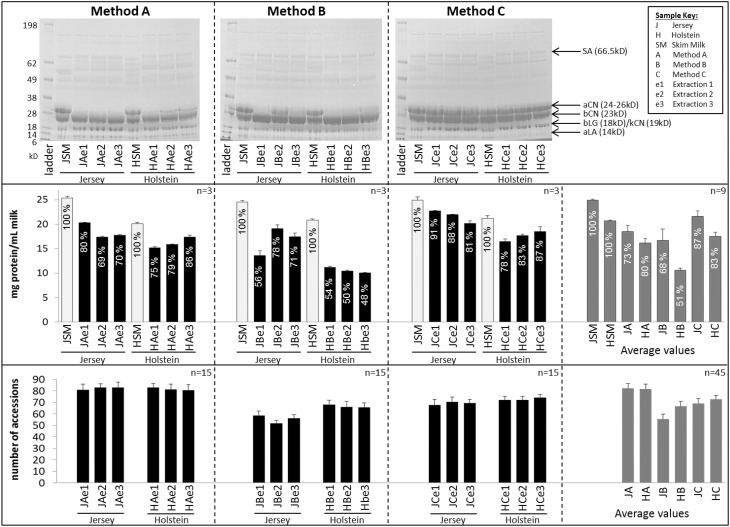
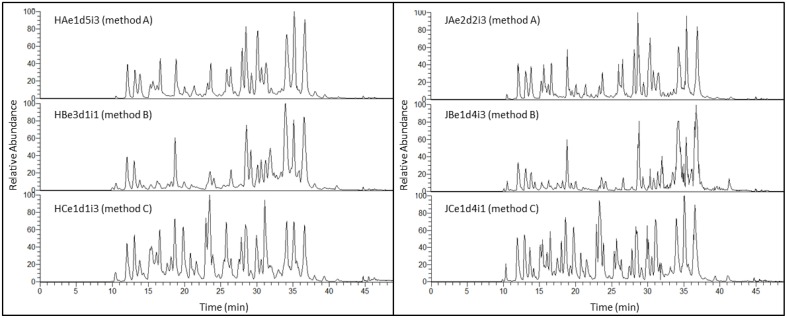
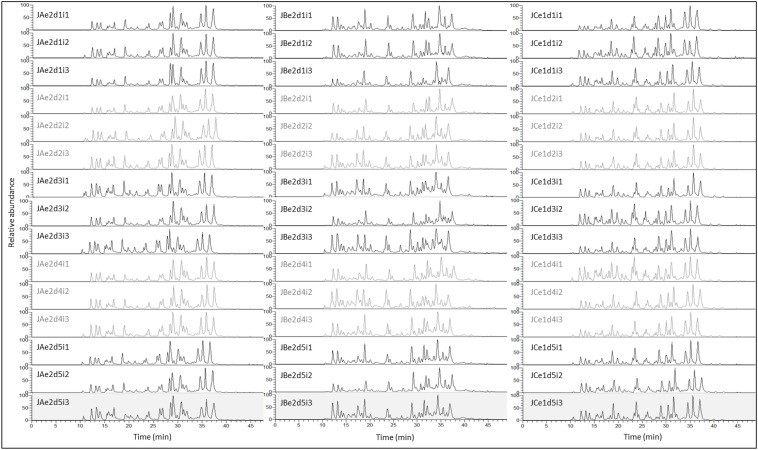
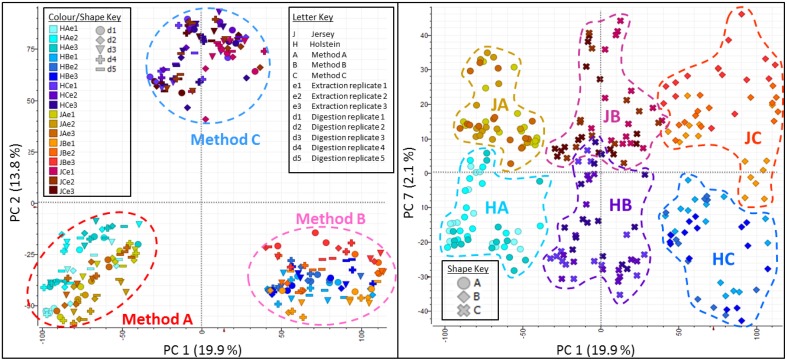
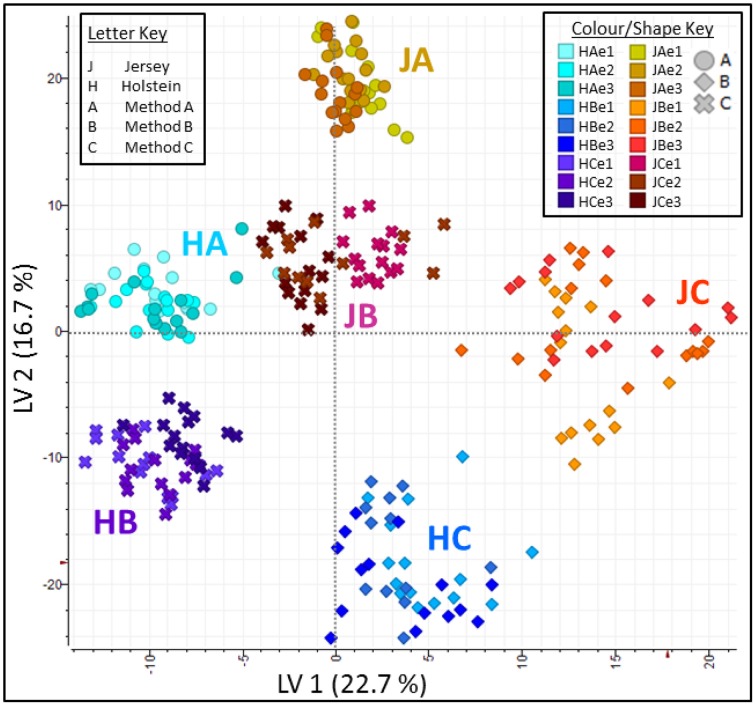
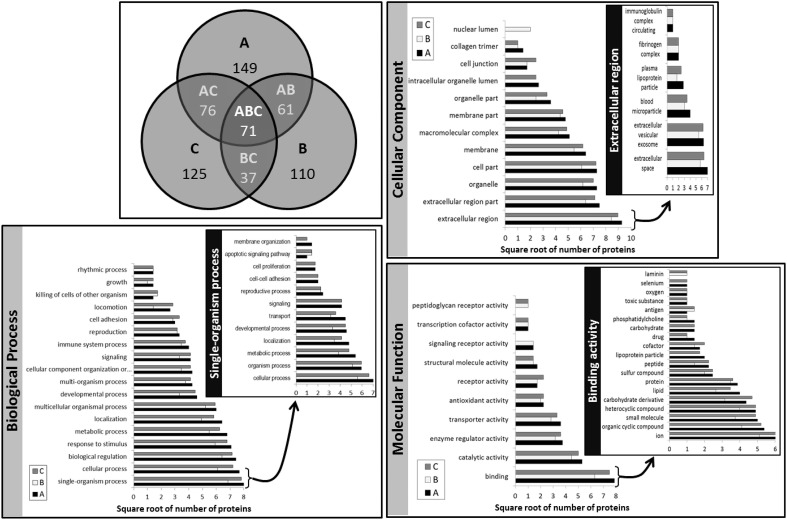
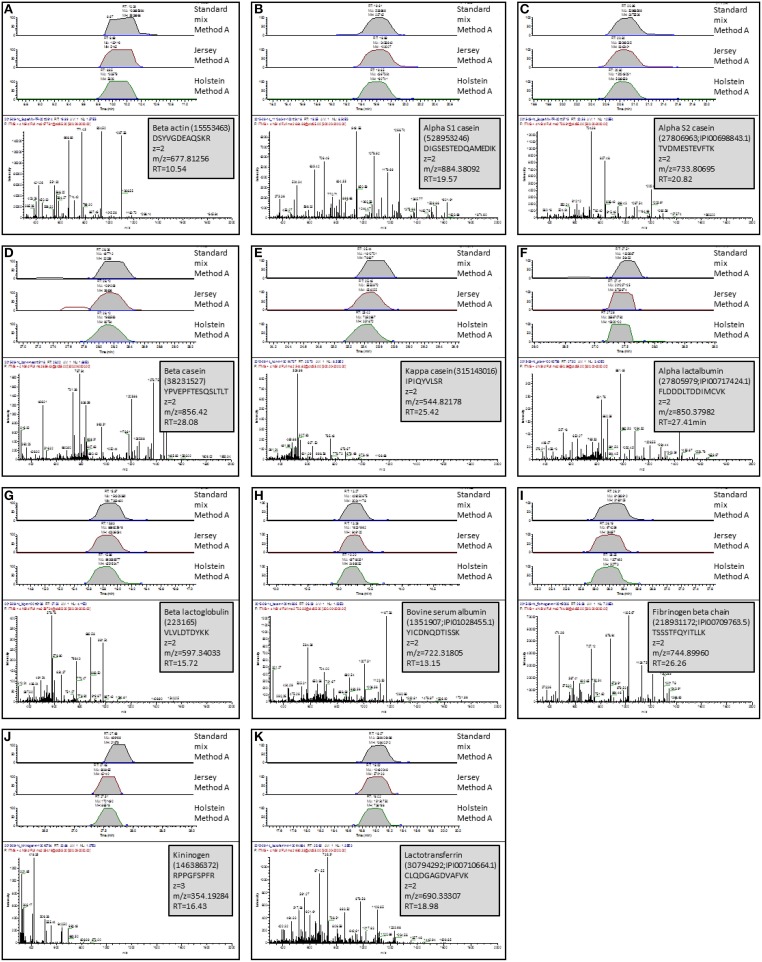
Milk is a complex fluid whose proteome displays a diverse set of proteins of high abundance such as caseins and medium to low abundance whey proteins such as ß-lactoglobulin, lactoferrin, immunoglobulins, glycoproteins, peptide hormones, and enzymes. A sample preparation method that enables high reproducibility and throughput is key in reliably identifying proteins present or proteins responding to conditions such as a diet, health or genetics. Using skim milk samples from Jersey and Holstein-Friesian cows, we compared three extraction procedures which have not previously been applied to samples of cows' milk. Method A (urea) involved a simple dilution of the milk in a urea-based buffer, method B (TCA/acetone) involved a trichloroacetic acid (TCA)/acetone precipitation, and method C (methanol/chloroform) involved a tri-phasic partition method in chloroform/methanol solution. Protein assays, SDS-PAGE profiling, and trypsin digestion followed by nanoHPLC-electrospray ionization-tandem mass spectrometry (nLC-ESI-MS/MS) analyses were performed to assess their efficiency. Replicates were used at each analytical step (extraction, digestion, injection) to assess reproducibility. Mass spectrometry (MS) data are available via ProteomeXchange with identifier PXD002529. Overall 186 unique accessions, major and minor proteins, were identified with a combination of methods. Method C (methanol/chloroform) yielded the best resolved SDS-patterns and highest protein recovery rates, method A (urea) yielded the greatest number of accessions, and, of the three procedures, method B (TCA/acetone) was the least compatible of all with a wide range of downstream analytical procedures. Our results also highlighted breed differences between the proteins in milk of Jersey and Holstein-Friesian cows.

Keywords: Jersey and Holstein-Friesian cow milk; proteome; replicates; shotgun nLC-ESI-MS; trypsin digestion.


Figures

Figure 1
Figure 1
Overview of the experimental workflow. Two full cream milk samples were collected from bulk tanks containing the milk of the whole herd of Holstein-Friesian or Jersey cows milked on that particular day. Following centrifugation of the milk to eliminate the cream, proteins were extracted from skim milk in triplicates (e1-e3) using methods A (urea), B (TCA/acetone), or C (methanol/chloroform). All 18 protein extracts were separated using SDS-PAGE, and their protein concentrations obtained in triplicates using the BCA assay. One hundred microgram proteins of each of the 18 extracts were trypsin-digested using five replicates (d1-d5). All 90 tryptic digests underwent Solid Phase Extraction (SPE) clean-up, ultrafiltration (UF) using a 30 kD MWCO; peptide concentrations were obtained using the BCA assay. One hundred nanogram peptides of each of the 90 digests were randomly injected for nLC-MS/MS analysis in triplicates (i1-i3) thus generating 270 MS result files.
Figure 2
Figure 2
Comparison of SDS-PAGE patterns (top panel), protein concentration (middle panel), and number of protein accessions identified per sample (bottom panel). Error bars are Standard Deviation (SD); the n number displayed at the top right corner of each box represents the number of replicates used for average and SD. Error bars for the protein assay are from the BCA technical triplicates. Error bars for the accession numbers are from 15 replicates (5 digestion replicates × 3 injection replicates). Recovery rates are indicated in percent in the protein assay and are computed relative to protein concentrations in skim milk (SM). SA, Serum Albumin; aCN, alpha-casein; bCN, beta-casein, bLG, beta-lactoglobulin; aLA, alpha-lactalbumin.
Figure 3
Figure 3
Total Ion Chromatograms (TIC) of three tryptic digests illustrating the effect of extraction method for Holstein-Friesian (left panel) or Jersey (right panel) breed. A TIC represents the summed intensity across the entire range of masses being detected at every point in the analysis. The duration of each nLC run is 50 min (x-axis), with tryptic peptides eluting from 10 to 42 min. Relative abundance (percent relative abundance with respect to the ion of highest abundance along the y-axis) of the most intense chromatographic peaks are comparable across methods. Most abundant peaks elute toward the end of the nLC run (27–38 min) for methods A (urea) and B (TCA/acetone), while they are evenly distributed along the whole elution pattern (11–38 min) for method C (methanol/chloroform). Subtle differences in peptide elution are visible between Holstein-Friesian (left panel) and Jersey (right panel) breeds. The nomenclature of each TIC exemplified here is explained in the Materials and Method Section and in Figure 1.
Figure 4
Figure 4
TIC of 45 Jersey tryptic digests illustrating the reproducibility at digestion (5 replicates) and injection (3 replicates) levels, for methods A (urea) (15 replicates), B (TCA/acetone) (15 replicates), and C (methanol/chloroform) (15 replicates). TICs of each set of three randomized repeated injections are alternatively black or gray. The x-axis represents the duration of the nLC run in min, while the y-axis represents the relative abundance of the chromatographic peaks which corresponds to the percent relative abundance with respect to the ion of highest abundance. With the exception of the inconsistent peptides eluting very early (10–12 min) or very late (39–42 min) during the 50 min nLC run, TICs are very reproducible across technical replicates, within a particular method. The nomenclature of each TIC exemplified here is explained in the Materials and Method Section and in Figure 1.
Figure 5
Figure 5
Principal component analyses (PCA) plots along Principal Component (PC) 1 against PC2 (left panel), and PC1 against PC7 (right panel). Together PC1 (19.9%) and PC2 (13.8%) explain 33.7% of the total variance and clearly separate the three methods. Within each method, all replicates cluster together whether it be at the extraction, digestion or injection levels. Breed explain 2.1% of the variance along PC7. On the plot PC1 against PC7, methods and breed are well-separated.
Figure 6
Figure 6
Partial Least Square (PLS) analysis plots along Latent Variable (LV) 1 against LV2. Together LV1 (22.7%) and LV2 (16.7%) explain 39.4% of the total variance, with a clear separation of breeds and methods, and displaying six tight clusters for JA, JB, JC, HA, HB, and HC.
Figure 7
Figure 7
Venn diagram of the number of unique protein accessions and Gene Ontology (GO) classification of known proteins per extraction method. A, method A (urea); B, method B (TCA/acetone); C, method C (methanol/chloroform); AB, methods A and B combined; AC, methods A and C combined; BC, methods B and C combined; ABC, methods A, B, and C combined. On the histograms illustrating GO classifications, the x-axis represents the square root of the number of proteins belonging to each of the classes distributed along the y-axis. The insets illustrate the histograms of the sub-classes of the GO class containing the greatest number of proteins.
Figure 8
Figure 8
Validation of protein identities using known protein standards. One peptide per standard was selected and Extracted Ion Chromatograms (EICs) were produced and compared across the standard mixture, Jersey bulk milk, and Holstein bulk mik tryptic digests. Retention times (RT) are comparable across samples. The MS/MS spectrum of the selected peptide is displayed below the EICs. Insets indicate the proteins to which this peptide belongs, the AA sequence of the selected peptide, its m/z, charge state and RT. (A), peptide from beta actin; (B), peptide from alpha S1 casein; (C), peptide from alpha S2 casein; (D), peptide from beta casein; (E), peptide from kappa casein; (F), peptide from alpha lactalbumin; (G), peptide from beta lactoglobulin; (H), peptide from bovine serum albumin; (I), peptide from fibrinogen; (J), peptide from kininogen; (K), peptide from lactotransferrin.

References

    1. Arnould V. M., Soyeurt H. (2009). Genetic variability of milk fatty acids. J. Appl. Genet. 50, 29–39. 10.1007/BF03195649 - DOI - PubMed
    1. Bendixen E., Danielsen M., Hollung K., Gianazza E., Miller I. (2011). Farm animal proteomics–a review. J. Proteomics 74, 282–293. 10.1016/j.jprot.2010.11.005 - DOI - PubMed
    1. Bligh E. G., Dyer W. J. (1959). A rapid method of total lipid extraction and purification. Can. J. Biochem. Physiol. 37, 911–917. - PubMed
    1. Boehmer J. L., Bannerman D. D., Shefcheck K., Ward J. L. (2008). Proteomic analysis of differentially expressed proteins in bovine milk during experimentally induced Escherichia coli mastitis. J. Dairy Sci. 91, 4206–4218. 10.3168/jds.2008-1297 - DOI - PubMed
    1. Bovine Genome Sequencing Analysis Consortium (2009). The genome sequence of taurine cattle: a window to ruminant biology and evolution. Science 324, 522–528. 10.1126/science.1169588 - DOI - PMC - PubMed