

Wastewater Disposal Wells, Fracking, and Environmental Injustice in Southern Texas
- PMID: 26794166
- PMCID: PMC4816143
- DOI: 10.2105/AJPH.2015.303000
Wastewater Disposal Wells, Fracking, and Environmental Injustice in Southern Texas
Abstract
Objectives: To investigate race and poverty in areas where oil and gas wastewater disposal wells, which are used to permanently inject wastewater from hydraulic fracturing (fracking) operations, are permitted.
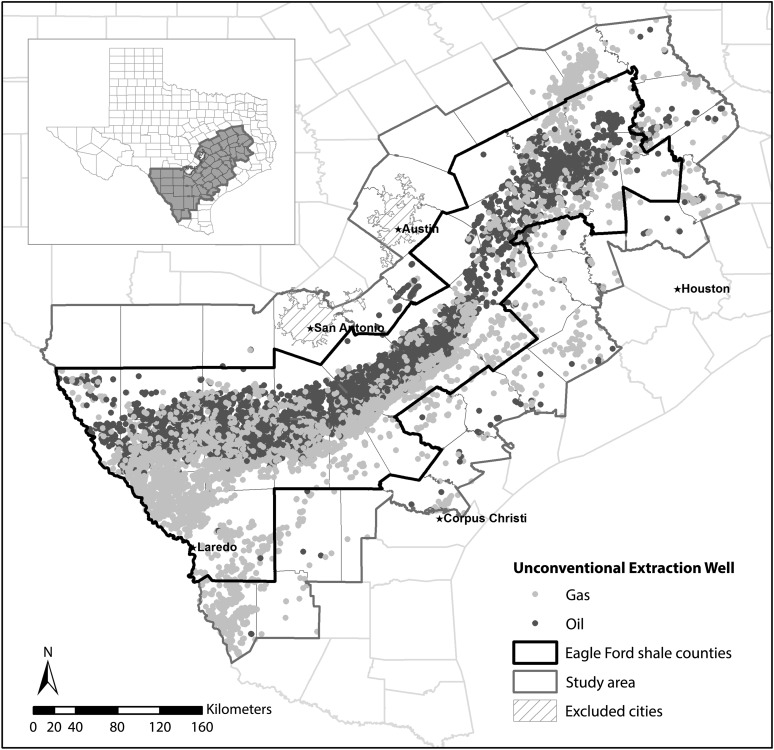
Methods: With location data of oil and gas disposal wells permitted between 2007 and 2014 in the Eagle Ford area, a region of intensive fracking in southern Texas, we analyzed the racial composition of residents living less than 5 kilometers from a disposal well and those farther away, adjusting for rurality and poverty, using a Poisson regression.
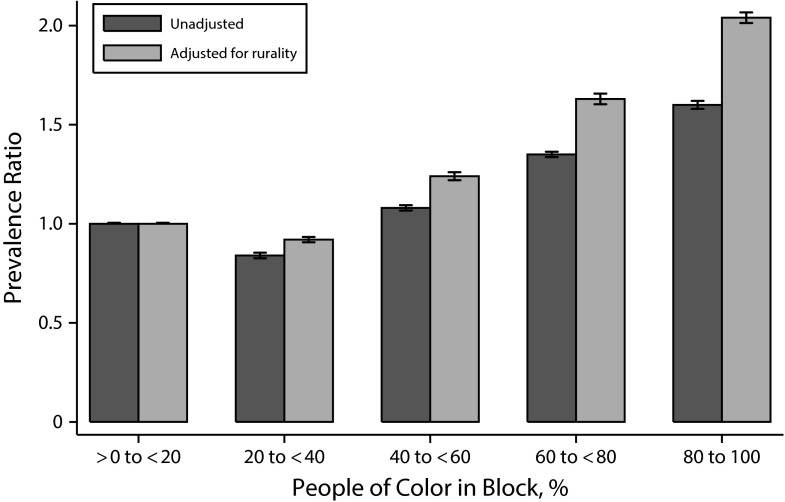
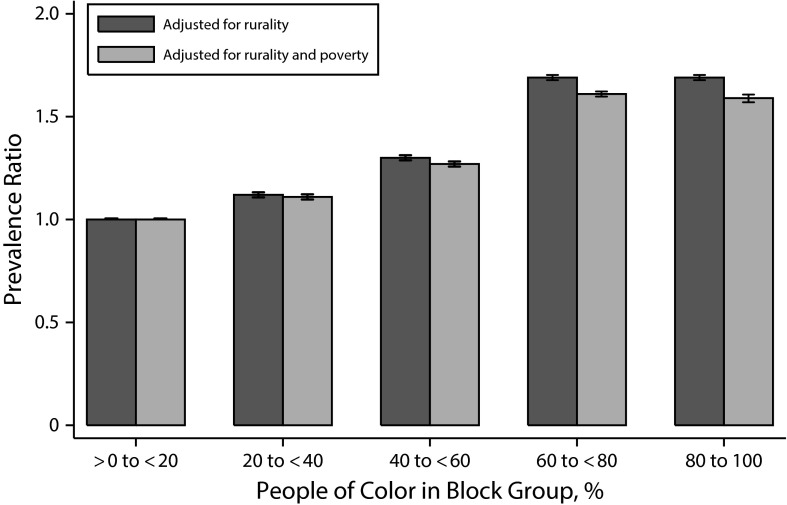
Results: The proportion of people of color living less than 5 kilometers from a disposal well was 1.3 times higher than was the proportion of non-Hispanic Whites. Adjusting for rurality, disposal wells were 2.04 times (95% confidence interval = 2.02, 2.06) as common in areas with 80% people of color or more than in majority White areas. Disposal wells are also disproportionately sited in high-poverty areas.
Conclusions: Wastewater disposal wells in southern Texas are disproportionately permitted in areas with higher proportions of people of color and residents living in poverty, a pattern known as "environmental injustice."
Figures
Similar articles
-
Environmental justice implications of hydraulic fracturing: A spatio-temporal analysis in Texas.J Environ Manage. 2025 Apr;380:124771. doi: 10.1016/j.jenvman.2025.124771. Epub 2025 Mar 14. J Environ Manage. 2025. PMID: 40088823
-
Environmental Justice Dimensions of Oil and Gas Flaring in South Texas: Disproportionate Exposure among Hispanic communities.Environ Sci Technol. 2020 May 19;54(10):6289-6298. doi: 10.1021/acs.est.0c00410. Epub 2020 May 5. Environ Sci Technol. 2020. PMID: 32338877 Free PMC article.
-
Spatial Modeling to Identify Sociodemographic Predictors of Hydraulic Fracturing Wastewater Injection Wells in Ohio Census Block Groups.Environ Health Perspect. 2018 Jun 27;126(6):067008. doi: 10.1289/EHP2663. eCollection 2018 Jun. Environ Health Perspect. 2018. PMID: 29957590 Free PMC article.
-
High volume hydraulic fracturing operations: potential impacts on surface water and human health.Int J Environ Health Res. 2016 Aug;26(4):361-80. doi: 10.1080/09603123.2015.1111314. Epub 2015 Nov 26. Int J Environ Health Res. 2016. PMID: 26608711 Review.
-
Potential water resource impacts of hydraulic fracturing from unconventional oil production in the Bakken shale.Water Res. 2017 Jan 1;108:1-24. doi: 10.1016/j.watres.2016.11.006. Epub 2016 Nov 4. Water Res. 2017. PMID: 27865434 Review.
Cited by
-
Collective Neoliberalism and Market Fundamentalism: Why Concerned People Acquiesce to the Oil and Gas Industry.Sociol Forum (Randolph N J). 2022 Jun;37(2):395-420. doi: 10.1111/socf.12800. Epub 2022 Mar 8. Sociol Forum (Randolph N J). 2022. PMID: 36035502 Free PMC article.
-
Flaring from Unconventional Oil and Gas Development and Birth Outcomes in the Eagle Ford Shale in South Texas.Environ Health Perspect. 2020 Jul;128(7):77003. doi: 10.1289/EHP6394. Epub 2020 Jul 15. Environ Health Perspect. 2020. PMID: 32673511 Free PMC article.
-
Associations between Household Water Fluoridation Status and Plain Tap or Bottled Water Consumption.JDR Clin Trans Res. 2021 Oct;6(4):440-447. doi: 10.1177/2380084420960419. Epub 2020 Sep 17. JDR Clin Trans Res. 2021. PMID: 32940115 Free PMC article.
-
Associations between residential proximity to oil and gas extraction and hypertensive conditions during pregnancy: a difference-in-differences analysis in Texas, 1996-2009.Int J Epidemiol. 2022 May 9;51(2):525-536. doi: 10.1093/ije/dyab246. Int J Epidemiol. 2022. PMID: 34897479 Free PMC article.
-
Breaking free from tunnel vision for climate change and health.PLOS Glob Public Health. 2023 Mar 9;3(3):e0001684. doi: 10.1371/journal.pgph.0001684. eCollection 2023. PLOS Glob Public Health. 2023. PMID: 36963098 Free PMC article. Review.
References
-
- Hamer G. Solid waste treatment and disposal: effects on public health and environmental safety. Biotechnol Adv. 2003;22(1–2):71–79. - PubMed
-
- Griffith J, Duncan RC, Riggan WB, Pellom AC. Cancer mortality in US counties with hazardous waste sites and ground water pollution. Arch Environ Health. 1989;44(2):69–74. - PubMed
-
- Bullard RD, Mohai P, Saha R, Wright B. Toxic wastes and race at twenty: why race still matters after all of these years. Envtl L. 2008;38(2):371–411.
Publication types
MeSH terms
Substances
Grants and funding
LinkOut - more resources
Full Text Sources
Other Literature Sources
