. 2016 Jan 19;44(1):194-206.
doi: 10.1016/j.immuni.2015.12.006. Epub 2016 Jan 12.

Compendium of Immune Signatures Identifies Conserved and Species-Specific Biology in Response to Inflammation

Affiliations

Compendium of Immune Signatures Identifies Conserved and Species-Specific Biology in Response to Inflammation

Jernej Godec et al. Immunity. .

Abstract

Gene-expression profiling has become a mainstay in immunology, but subtle changes in gene networks related to biological processes are hard to discern when comparing various datasets. For instance, conservation of the transcriptional response to sepsis in mouse models and human disease remains controversial. To improve transcriptional analysis in immunology, we created ImmuneSigDB: a manually annotated compendium of ∼5,000 gene-sets from diverse cell states, experimental manipulations, and genetic perturbations in immunology. Analysis using ImmuneSigDB identified signatures induced in activated myeloid cells and differentiating lymphocytes that were highly conserved between humans and mice. Sepsis triggered conserved patterns of gene expression in humans and mouse models. However, we also identified species-specific biological processes in the sepsis transcriptional response: although both species upregulated phagocytosis-related genes, a mitosis signature was specific to humans. ImmuneSigDB enables granular analysis of transcriptomic data to improve biological understanding of immune processes of the human and mouse immune systems.


Figures

Figure 1
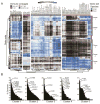
Figure 1. ImmuneSigDB collection is derived from re-analysis of published data
(A) A schematic of the ImmuneSigDB pipeline. (B) Number gene sets corresponding to major immune lineages or cell lines and (C) species of origin contained in ImmuneSigDB. (D) Number of pairwise comparisons made per each study used in ImmuneSigDB. (E) Overlap in gene set membership in ImmuneSigDB with MSigDB gene sets. Heatmap indicates False Discovery Rate (FDR) values of each pairwise comparison between gene sets. Highlighted are representative biological processes in each of the significantly overlapping clusters of gene sets. (F) Distribution of the FDR ranges of significance across all pair-wise comparisons of gene set membership. See also Figures S1 and S2.
Figure 2
Figure 2. Mouse immune lineages are accurately clustered using ImmuneSigDB enrichments
(A) Unsupervised bi-clustering of ssGSEA values using ImmuneSigDB in samples of four representative mouse immune lineages. Hierarchical clustering of the 10% of gene sets with highest mean absolute deviation is shown. Species of origin of gene sets indicated by green (human) and purple (mouse) bars on the right. Major branches of the gene set dendrogram clusters are indicated by the numbered black bars on the right. (B) Distribution of genes contained in gene sets in the same gene set dendrogram clusters as indicated in (A). See also Figure S3.
Figure 3
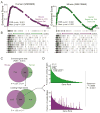
Figure 3. Transcriptional programs are conserved across mouse and human immune lineages
(A) GSEA of a randomly selected human study comparing LPS-stimulated and unstimulated dendritic cells using ImmuneSigDB gene sets derived from the study itself (grey) or gene sets from other mouse (purple) or human (green) datasets of LPS-stimulated myeloid cells. Mountain plots show all genes ranked by differential expression in sepsis versus control conditions on the X-axis, and the curves indicate cumulative enrichment (measured by enrichment score on the Y-axis). The ticks below the line correspond to the position of genes in each gene set. (B–D) Analysis as in (A) for three additional cell differentiation states: plasma cells (B), Tregs (C), and memory B cells (D). All gene sets shown are significantly enriched (FDR < 0.001).
Figure 4
Figure 4. The transcriptional response to sepsis is conserved in humans and mouse models
(A and B) GSEA of the set of genes up-regulated in mouse sepsis (GSE19668, C57BL/6) in the ranked list of genes up-regulated in human sepsis (GSE9960, Gram negative infection) (A, left); and of the corresponding human sepsis gene set enriched in rank ordered list of genes up-regulated in mouse sepsis (A, right). Mountain plots indicate cumulative enrichment, and (B) ticks below the line correspond to the position of genes in the 10 most enriched gene sets from ImmuneSigDB in the rank order of genes up-regulated in sepsis versus control conditions (X-axis). (C) Venn diagram showing overlap in the identity of significantly enriched ImmuneSigDB gene sets in mouse (purple) or human (green) sepsis dataset (top) and the number of shared leading edge genes in the gene sets enriched in both species (bottom). Statistical significance calculated by the hypergeometric test. (D) Frequency of the genes occurring in the leading edge of a gene sets enriched in human (green) and mouse (purple) sepsis datasets. Statistical significance of the similarity in gene rank is calculated by the Spearman test. See also Figure S4.
Figure 5
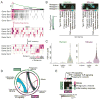
Figure 5. Leading edge clustering using non-negative matrix factorization (NMF) identifies metagenes representing distinct biological processes
(A) A schematic of the process by which leading edge metagenes are identified. (B) Biological annotation of metagenes identified in the studies analyzed in Figure 4 generated using GO terms. (C) Violin plots showing P values of significance of GO Term overlaps with human (left) and mouse (right) sepsis metagenes (LEM), or equivalent-size samples of leading edge genes, or randomly selected genes. (D) Circos plot of the relative size and overlap of metagenes in mouse (purple, outer segment) and human (green, outer segment) sepsis datasets. Relative number of genes in metagenes is indicated by segment length of the inner circle. Thickness of the ribbon corresponds to the relative number of genes shared between metagenes in the two species. (E) Heatmap of P-values corresponding to significance of overlap in pairwise comparison of metagene gene membership (yellow, highly significant; black, not significant). Statistical significance of the overlap calculated by hypergeometric test. See also Figures S5 and S6.
Figure 6
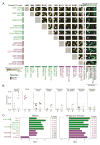
Figure 6. ImmuneSigDB identifies shared and unique biology in mouse and human sepsis studies
(A) Pairwise overlaps of all metagenes from mouse (purple bars) and human (green bars) sepsis studies. Heatmap indicates P-values corresponding to significance of overlap between each metagene (small squares) in each study (larger squares; yellow, highly significant; black, not significant). The biological annotation of each metagene is based on the significance of enrichment of the GO term indicated (blue, large overlap; black, no overlap) (right). The most significantly enriched GO term annotating each metagene is indicated by the key in lower right. (B) Jaccard index representing the extent of overlap of metagenes from human (H) and mouse (M) studies. Colored are metagenes that are annotated with the respective biological process as in (A). (C) Enrichment scores of biological processes that are species-specific (e.g. mitosis, left) or shared (e.g. phagocytic vesicle, right) in the human (green bars) and mouse (purple bars) sepsis datasets. Significance of the enrichment of the named biological process in each data set is indicated by the P-values on the right.

Similar articles

Cited by

References

    1. Abazeed ME, Adams DJ, Hurov KE, Tamayo P, Creighton CJ, Sonkin D, Giacomelli AO, Du C, Fries DF, Wong KK, et al. Integrative radiogenomic profiling of squamous cell lung cancer. Cancer research. 2013;73:6289–6298. - PMC - PubMed
    1. Ahn SH, Deshmukh H, Johnson N, Cowell LG, Rude TH, Scott WK, Nelson CL, Zaas AK, Marchuk DA, Keum S, et al. Two genes on A/J chromosome 18 are associated with susceptibility to Staphylococcus aureus infection by combined microarray and QTL analyses. PLoS pathogens. 2010;6:e1001088. - PMC - PubMed
    1. Ashburner M, Ball CA, Blake JA, Botstein D, Butler H, Cherry JM, Davis AP, Dolinski K, Dwight SS, Eppig JT, et al. Gene ontology: tool for the unification of biology. The Gene Ontology Consortium. Nature genetics. 2000;25:25–29. - PMC - PubMed
    1. Baitsch L, Baumgaertner P, Devevre E, Raghav SK, Legat A, Barba L, Wieckowski S, Bouzourene H, Deplancke B, Romero P, et al. Exhaustion of tumor-specific CD8(+) T cells in metastases from melanoma patients. The Journal of clinical investigation. 2011;121:2350–2360. - PMC - PubMed
    1. Barbie DA, Tamayo P, Boehm JS, Kim SY, Moody SE, Dunn IF, Schinzel AC, Sandy P, Meylan E, Scholl C, et al. Systematic RNA interference reveals that oncogenic KRAS-driven cancers require TBK1. Nature. 2009;462:108–112. - PMC - PubMed

Publication types