. 2016 Mar 2:214:26-32.
doi: 10.1016/j.virusres.2016.01.007. Epub 2016 Jan 18.

Prostaglandin E2 production during neonatal respiratory infection with mouse adenovirus type 1

Affiliations

Prostaglandin E2 production during neonatal respiratory infection with mouse adenovirus type 1

Megan C Procario et al. Virus Res. .

Abstract

Neonatal mice are more susceptible than adults to mouse adenovirus type 1 (MAV1) respiratory infection. In adult mice, MAV-1 respiratory infection induces production of prostaglandin E2 (PGE2), a lipid mediator that exerts suppressive effects on a variety of host immune functions. We tested the hypothesis that exaggerated PGE2 production in neonatal mice contributes to increased susceptibility to MAV-1. PGE2 concentrations were lower in lungs of uninfected neonatal mice than in adults. PGE2 production was induced by both MAV-1 and a nonspecific stimulus to a greater degree in neonatal mice than in adults, but only in adults was PGE2 induced in a virus-specific manner. Lung viral loads were equivalent in PGE2-deficient neonatal mice and wild type controls, as was virus-induced expression of IFN-γ, IL-17A, and CCL5 in the lungs. PGE2 deficiency had minimal effect on production of virus-specific IgG or establishment of protective immunity in neonatal mice. Collectively, our data indicate that lung PGE2 production is exaggerated early in life, but this effect does not mediate increased susceptibility to MAV-1 infection.

Keywords: Adenovirus; Neonatal infection; Prostaglandin E(2); Viral pathogenesis.


Figures

Figure 1
Figure 1
Baseline lung PGE2 production and EP receptor expression. A) ELISA was used to quantify PGE2 concentrations in lung homogenates from uninfected mice at the indicated ages. Combined data from n=3–6 mice per group are presented as means ± S.E.M. Statistical analysis of the trend over ages was performed using one-way ANOVA. B) RT-qPCR was used to quantify expression of EP receptors in lungs of uninfected mice at the indicated ages. Combined data from n=4–8 mice per group are presented as means ± S.E.M. Statistical comparison was made using the Mann-Whitney rank sum test. *P<0.05 and **P<0.01, comparing young to old mice.
Figure 2
Figure 2
Virus-induced lung PGE2 production. A) Neonatal (7 days of age) mice were infected i.n. with MAV-1 or mock infected with conditioned media. ELISA was used to quantify PGE2 concentrations in lung homogenates at the indicated time points. Combined data from n=22–29 mice per group at 7 dpi and n=3 mice per group at 14 dpi are presented as means ± S.E.M. B) Adult (6–8 weeks of age) mice were infected i.n. with MAV-1 or mock infected with conditioned media. ELISA was used to quantify PGE2 concentrations in lung homogenates at the indicated time points. Combined data from n=10–13 mice per group are presented as means ± S.E.M. C) Data at 7 dpi from Figures 2A and 2B are presented as lung PGE2 concentrations relative to concentrations in age-matched uninfected mice from Figure 1. Statistical comparisons were made using two-way ANOVA followed by Bonferroni’s multiple comparison tests. **P<0.01, comparing mock to MAV-1. ††P< 0.01 comparing neonatal and adult mice within the same condition.
Figure 3
Figure 3
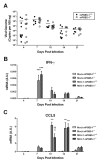
Effects of PGE2 deficiency on acute MAV-1 respiratory infection in neonatal mice. Neonatal mPGES-1+/+ and mPGES-1−/− mice were infected i.n. with MAV-1 or mock infected with conditioned media. A) DNA was extracted from lungs harvested at the indicated time points. qPCR was used to quantify MAV-1 genome copies in lung DNA. DNA viral loads are expressed as copies of MAV-1 genome per 100 ng of input DNA. Individual circles represent values for individual mice and horizontal bars represent means for each group. B, C) RNA was extracted from lungs harvested at the indicated time points and RT-qPCR was used to quantify cytokine expression, which is shown in arbitrary units. Combined data from 3 independent experiments, n=3–10 mice per group (2 mock-infected mPGES-1−/− mice at 14 dpi), are presented as means ± S.E.M. Statistical comparisons were made using two-way ANOVA followed by Bonferroni’s multiple comparison tests. ***P<0.001 comparing mock to MAV-1 for a given genotype. ††P< 0.01, comparing mPGES-1+/+ to mPGES-1−/− mice within the same condition.
Figure 4
Figure 4
Effects of PGE2 deficiency on adaptive immune responses to MAV-1 respiratory infection in neonatal mice. A) Neonatal mPGES-1+/+ and mPGES-1−/− mice were infected i.n. with MAV-1. ELISA was used to quantify virus-specific IgG in the serum at 21 dpi. Data are presented as means ± S.E.M. Statistical comparisons were made using two-way ANOVA followed by Bonferroni’s multiple comparison tests. **P<0.01 comparing mPGES-1+/+ (n=5) to mPGES-1−/− (n=7) mice. B) Neonatal mPGES-1+/+ and mPGES-1−/− mice were infected i.n. with MAV-1. At 28 dpi, mice were rechallenged i.n. with MAV-1. Age-matched naïve mice infected for the first time were included as controls. Lungs were harvested at 7 days following rechallenge (or following primary infection of control mice). DNA was extracted from lungs and qPCR was used to quantify DNA viral loads, which are expressed as copies of MAV-1 genome per 100 ng of input DNA. Individual circles represent values for individual mice and horizontal bars represent means for each group. Statistical comparisons were made using the Mann-Whitney rank sum test for differences between conditions within a given genotype. *P<0.05 and **P<0.01 comparing primary to secondary infection within a genotype.

References

    1. Adkins B, Bu Y, Guevara P. Murine neonatal CD4+ lymph node cells are highly deficient in the development of antigen-specific Th1 function in adoptive adult hosts. Journal of immunology. 2002;169(9):4998–5004. - PubMed
    1. Adkins B, Du RQ. Newborn mice develop balanced Th1/Th2 primary effector responses in vivo but are biased to Th2 secondary responses. Journal of immunology. 1998;160(9):4217–4224. - PubMed
    1. Aronoff DM, Canetti C, Peters-Golden M. Prostaglandin E2 inhibits alveolar macrophage phagocytosis through an E-prostanoid 2 receptor-mediated increase in intracellular cyclic AMP. Journal of immunology. 2004;173(1):559–565. - PubMed
    1. Aronoff DM, Canetti C, Serezani CH, Luo M, Peters-Golden M. Cutting edge: macrophage inhibition by cyclic AMP (cAMP): differential roles of protein kinase A and exchange protein directly activated by cAMP-1. Journal of immunology. 2005;174(2):595–599. - PubMed
    1. Ballinger MN, Peters-Golden M, Moore BB. Impaired neonatal macrophage phagocytosis is not explained by overproduction of prostaglandin E2. Respiratory research. 2011;12:155. - PMC - PubMed

Publication types

MeSH terms

LinkOut - more resources