

Automated Quantification of Capillary Nonperfusion Using Optical Coherence Tomography Angiography in Diabetic Retinopathy
- PMID: 26795548
- PMCID: PMC4978127
- DOI: 10.1001/jamaophthalmol.2015.5658
Automated Quantification of Capillary Nonperfusion Using Optical Coherence Tomography Angiography in Diabetic Retinopathy
Abstract
Importance: Macular ischemia is a key feature of diabetic retinopathy (DR). Quantification of macular ischemia has potential as a biomarker for DR.
Objective: To assess the feasibility of automated quantification of capillary nonperfusion as a potential sign of macular ischemia using optical coherence tomography (OCT) angiography.
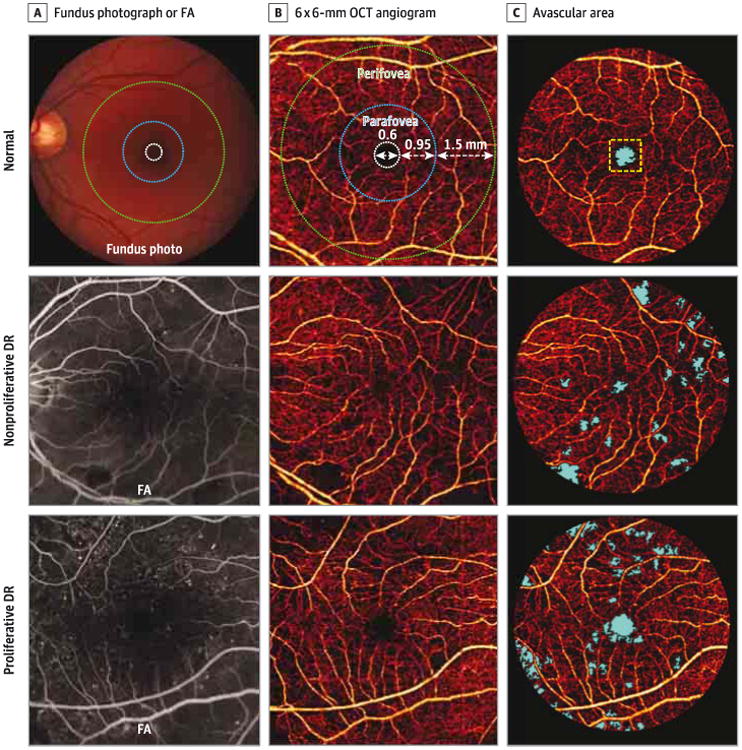
Design, setting, and participants: An observational study conducted in a tertiary, subspecialty, academic practice evaluated macular nonperfusion with 6 × 6-mm OCT angiography obtained with commercially available 70-kHz OCT and fluorescein angiography (FA). The study was conducted from January 22 to September 18, 2014. Data analysis was performed from October 1, 2014, to April 7, 2015. Participants included 12 individuals with normal vision serving as controls and 12 patients with various levels of DR.
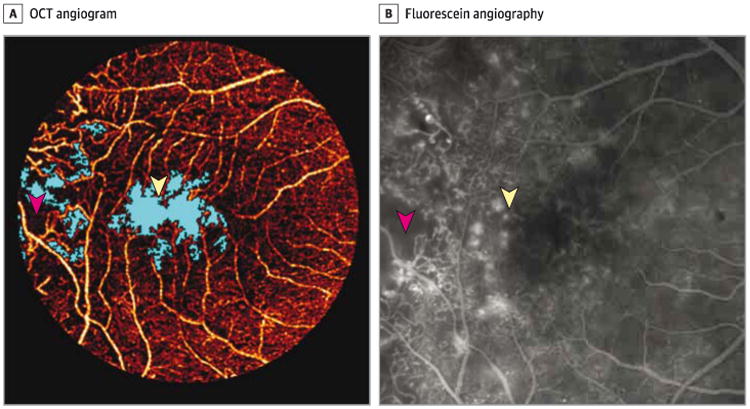
Main outcomes and measures: Preplanned primary measures were parafoveal and perifoveal vessel density, total avascular area, and foveal avascular zone as detected with 6 × 6-mm OCT angiography and analyzed using an automated algorithm. Secondary measures included the agreement of the avascular area between the OCT angiogram and FA.
Results: Compared with the 12 healthy controls (11 women; mean [SD] age, 54.2 [14.2] years), the 12 participants with DR (4 women; mean [SD] age, 55.1 [12.1] years) had reduced parafoveal and perifoveal vessel density by 12.6% (95% CI, 7.7%-17.5%; P < .001) and 10.4% (95% CI, 6.8%-14.1%; P < .001), respectively. Total avascular area and foveal avascular zone area were greater in eyes with DR by 0.82 mm2 (95% CI, 0.65-0.99 mm2; P = .02) and 0.16 mm2 (95% CI, 0.05-0.28 mm2; P < .001). The agreement between the vascular areas in the OCT angiogram and FA had a κ value of 0.45 (95% CI, 0.21-0.70; P < .001). Total avascular area in the central 5.5-mm-diameter area distinguished eyes with DR from control eyes with 100% sensitivity and specificity.
Conclusions and relevance: Avascular area analysis with an automated algorithm using OCT angiography, although not equivalent to FA, detected DR reliably in this small pilot study. Further study is necessary to determine the usefulness of the automated quantification in clinical practice.
Conflict of interest statement
Figures
Comment in
-
Optical Coherence Tomographic Angiography in Diabetic Macular Ischemia: A New Step Forward.JAMA Ophthalmol. 2016 Apr;134(4):373-4. doi: 10.1001/jamaophthalmol.2015.4821. JAMA Ophthalmol. 2016. PMID: 26795200 No abstract available.
References
-
- Early Treatment Diabetic Retinopathy Study Research Group. Fluorescein angiographic risk factors for progression of diabetic retinopathy: ETDRS report number 13. Ophthalmology. 1991;98(5 suppl):834–840. - PubMed
-
- Sim DA, Keane PA, Fung S, et al. Quantitative analysis of diabetic macular ischemia using optical coherence tomography. Invest Ophthalmol Vis Sci. 2014;55(1):417–423. - PubMed
-
- Sakata K, Funatsu H, Harino S, Noma H, Hori S. Relationship between macular microcirculation and progression of diabetic macular edema. Ophthalmology. 2006;113(8):1385–1391. - PubMed
-
- Sakata K, Funatsu H, Harino S, Noma H, Hori S. Relationship of macular microcirculation and retinal thickness with visual acuity in diabetic macular edema. Ophthalmology. 2007;114(11):2061–2069. - PubMed
Publication types
MeSH terms
Grants and funding
LinkOut - more resources
Full Text Sources
Other Literature Sources
Medical
Miscellaneous
