

Inducible chromatin priming is associated with the establishment of immunological memory in T cells
- PMID: 26796577
- PMCID: PMC4772849
- DOI: 10.15252/embj.201592534
Inducible chromatin priming is associated with the establishment of immunological memory in T cells
Abstract
Immunological memory is a defining feature of vertebrate physiology, allowing rapid responses to repeat infections. However, the molecular mechanisms required for its establishment and maintenance remain poorly understood. Here, we demonstrated that the first steps in the acquisition of T-cell memory occurred during the initial activation phase of naïve T cells by an antigenic stimulus. This event initiated extensive chromatin remodeling that reprogrammed immune response genes toward a stably maintained primed state, prior to terminal differentiation. Activation induced the transcription factors NFAT and AP-1 which created thousands of new DNase I-hypersensitive sites (DHSs), enabling ETS-1 and RUNX1 recruitment to previously inaccessible sites. Significantly, these DHSs remained stable long after activation ceased, were preserved following replication, and were maintained in memory-phenotype cells. We show that primed DHSs maintain regions of active chromatin in the vicinity of inducible genes and enhancers that regulate immune responses. We suggest that this priming mechanism may contribute to immunological memory in T cells by facilitating the induction of nearby inducible regulatory elements in previously activated T cells.
Keywords: chromatin; epigenetics; gene regulation; immunity; memory T cell.
© 2016 The Authors. Published under the terms of the CC BY 4.0 license.
Figures

- A
The 130‐kb human
IL 3/CSF 2BAC transgene. The insulator (Ins) and enhancer elements (E) are shown as boxes. - B
Steps in the route to T blast cell transformation and re‐activation. Purified
CD 4+ orCD 8+ T cells were activated with 2 μg/ml ConA for 40 h and then maintained inIL ‐2 asTB . Cells were re‐stimulated with 20 ng/mlPMA and 2 μM calcium ionophore (PMA /I). - C
Inducible
mRNA expression levels inCD 4TN andTB stimulated withPMA /I for the indicated times.mRNA levels were expressed relative to the levels of beta‐2 microglobulin (B2m) with SEM. The number of replicates (n) for each is shown underneath. - D
UCSC genome browser shot of the humanIL 3/CSF 2 locus showingDN ase‐Seq and ChIP ‐Seq inCD 4TN andTB with (red) and without stimulation (black) withPMA /I for 2 h, plus theENCODE Jurkat T‐cellDN ase‐Seq data (Thurman et al, 2012). Black arrows represent stableDHS s and red arrows are inducibleDHS s, with the distances in kilobases of theDHS from either theIL 3 orCSF 2 promoters. - E
Human
CSF 2mRNA expression inCD 4TN andCD 4TM stimulated for 2 h withPMA /I, expressed as in (C). - F
Southern blot
DNA hybridization analyses ofDHS s in humanTN andTM and C42TB . - G, H
Luciferase reporter gene assays in stimulated Jurkat T cells transfected with the
pXPG plasmid containing theCSF 2 (G) orIL 3 (H) promoter alone or in combination with the indicatedpDHS and enhancerDNA regions as defined in (D). TheIL 3 −4.1/1.5 construct contains a contiguous region spanning theIL 3 promoter from −4.3 kb to +50 bp. The number of replicates (n) is shown below, and the error bars indicate SEM (G) or SD (H).

PCR analyses ofmRNA expression ofNFAT andAP ‐1 family transcription factors inCD 4TN andTB stimulated withPMA /I for the times indicated. Expression levels are normalized to the levels of B2m. Values represent the mean and SEM of 3 to 10 replicates, with a median of 5 replicates for each value shown.UCSC genome browser shot of a 900‐kb region of mouse chr11 showingDN ase I‐Seq forCD 4 andCD 8TN ,TB , andTM plus published datasets for H3K27me3 inCD 4 andCD 8TN and Th2 cells.TN (2) andTB (2) represent biological replicates.

Map of the region upstream of
IL 3 gene spanning the −34‐kbpDHS and −37‐kb inducible enhancer, together with the locations of the guideRNA s used to delete the −34‐kbpDHS and thePCR primers used to detect the deletion. On the right is aPCR analysis confirming deletion of the −34‐kbpDHS on both alleles in 2 out of 4 clones selected for the analyses shown below.Average
IL 3 (upper) andJUN (lower)mRNA expression in the −34‐kb−/− clones A and B compared to theWT clones A and B stimulated for 2, 4, and 8 h withPMA /I.mRNA levels were normalized first toGAPDH and then to the level of gene expression in untransfected Jurkat T cells. Values represent the average of two −34‐kb−/− and twoWT clones from two independent experiments (n = 4) with SD.IL 3 andJUN mRNA expression levels after 2 h of stimulation withPMA /I normalized as in (B). The standard error is shown from five independent experiments.Deletion of the −34‐kb
pDHS impairs induction of theiDHS at the −37‐kb inducible enhancer. The −34‐kb−/− clones A and B, theWT clones A and B, and untransfected Jurkat T cells were stimulated withPMA /I for 3 h. A range ofDN ase I concentrations were used to determine the chromatin accessibility of the −37‐kbiDHS in two independent clones, with values expressed relative to normal unstimulated Jurkat cells. Increased accessibility was detected by a reduction in signal detected byqPCR . The activeTBP promoter and an inactive region on Chr18 are used as controls. Independent experiments for the −34‐kb−/− andWT clones A and B compared to the untransfected Jurkat T cells are shown in the upper and lower panels, respectively.
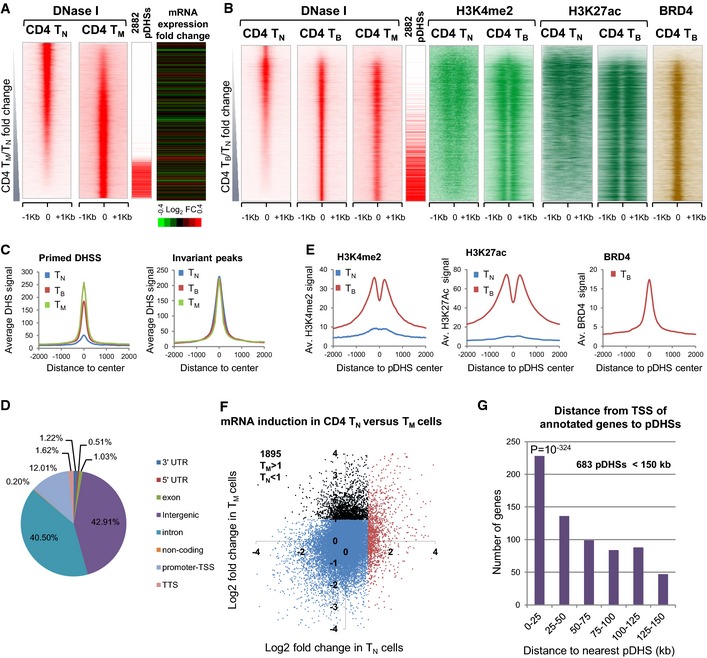
Density maps depicting all
DN ase‐Seq peaks in the order of increasingDN ase‐Seq tag count signal forCD 4TM compared toTN . On the right are the locations of the defined subset of 2,882pDHS s and the log2TM /TN fold change in expression of the closest gene to the correspondingDHS .Density maps for all
DN ase‐Seq and ChIP ‐Seq peaks shown in order of increasingDN ase‐Seq tag count signal forCD 4TB compared toTN . TheTN H3K27ac track is from published data (Lara‐Astiaso et al, 2014).Average
DHS signal at 2,882pDHS s and 2,882 invariantDHS s inCD 4TN ,TB , andTM . The locations of the 2,882pDHS s are indicated in (A) and (B).Pie chart showing the genomic distribution of
pDHS s.Average H3K4me2, H3K27ac, and
BRD 4 signal at 2,882pDHS s.Plot of the log2 fold change in gene expression following 2 h
PMA /I forCD 4TM compared toTN . 1,895 genes (black) have a log2 fold change of 1 or above inTM but notTN .Distance and gene expression analyses. P‐value represents χ2 significance against randomly expected number of pDHSs within 25 kb of a TSS (method described in Appendix).

- A
Density maps representing the
DN ase‐Seq peaks in the cell types indicated at the top, shown in the order of increasingDN ase‐Seq tag count signal for theCD 4TB compared toCD 4TN .TB (2) andTN (2) are biological replicates. - B
Average
DN ase I profile at thepDHS s inCD 4TB (2) andTN (2),CD 8TB andTN , plus the average H3K27me3 profiles for publically availableCD 4 andCD 8 datasets inTN TM , effector T cells (TE ), and Th2 cells. - C, D
Boxplots of log2 mRNA expression fold change (C) and absolute expression levels (D) of the 1,895 TM‐specific genes in CD4 TN, CD4 TB and CD4 TM. Boxes represent the first and third quartile, respectively. Bottom and top whiskers represent the first and third quartile minus and plus 1.5 times the interquartile range.
- E
Gene ontology for the 1,895
TM ‐specific genes. - F
Mean cumulative
mRNA array values for two alternatively spliced forms of the gene encodingNFAT c1. Values are based on 4 separate micro‐array values and are shown with SD. - G
Hierarchical correlation clustering of
mRNA levels for the top 1% of genes with the highest variance ofmRNA expression between populations ofCD 4 andCD 8TN ,TB , andTM . Treatment withPMA /I is indicated by a “+” sign. Pearson correlations are shown according to the color scale (top left). B, N, and + (right) indicate the dominant groups resulting from clustering.

- A
Density maps identifying
iDHS s and showingDN ase‐Seq and H3K4me2 ChIP ‐Seq peaks in order of increasingDN ase‐Seq tag count signal forCD 4TB + compared toTB cells. Also depicted are the locations of 6,823 majorDHS s that are 5.5‐fold induced and a subset of 1,217 of theseiDHS s that are 11‐fold induced. On the right is the log2TB +/TB fold change in expression of the closest gene to the correspondingDHS . - B
Average
DN ase I profiles of the 1,217iDHS s inTN (+/−PMA /I) andTB (+/−PMA /I) (left), and inTM (+/−PMA /I) (right). - C
Average
DN ase I and H3K27ac profiles of the 1,049dDHS s inTN andTB (+/−PMA /I) which are fourfold diminished after stimulation. - D
The genomic distribution of the 1,217
iDHS s. - E–H
Barplots showing the number of TM‐specific genes with an iDHS within 150 kb of the TSS (E); the median distances between the TSSs and the closest iDHS of the TM‐specific genes grouped according to the fold induction in TM after 2 h plus PMA/I compared to TM for genes which had a TSS < 1 Mb from an iDHS (F); the number of TM‐specific genes which have an iDHS within 150 kb of the 683 pDHSs (G); and the median distances from the closest pDHS to the closest iDHS grouped according to the fold induction in TM after 2 h plus PMA/I compared to TM (H). P‐values represent either χ2 significance against randomly expected number of DHSs within 25 kb (F and H) or t‐test significance against equally sized random DHSs (E and G). The methods used to calculate P‐values are described in the Appendix.
- I
UCSC genome browser shot of the Th2 Il4/Il13/Rad50 locus showingDN aseI‐Seq and ChIP ‐Seq. Black and red arrows representpDHS s andiDHS s, respectively. The values above the arrows indicate the distance in kb from the Il4 promoter.

Average H3K4me2, H3K27ac, and
BRD 4 signals at the 1,217iDHS s inCD 4TB andTB +, plus H3K4me2 and H3K27ac forTN .Gene ontology for the 187
TM ‐specific genes located within 25 kb of both apDHS and aniDHS .DN ase I‐Seq and ChIP ‐Seq at the Il10 locus inCD 4TN ,TM ,TB ,TB +, and Th2 cells andCD 8TN andTB .Il4 and Il10
mRNA expression inCD 4TN andCD 4TM stimulated withPMA /I for the times indicated. Relative mRNA values are expressed as in Fig 1C, with SEM. The number of replicates for each (n) is shown underneath.

De novo motifs enriched within 2,882
pDHS s determined usingHOMER .Motif distribution in all
DHS s ordered by increasingDN ase‐Seq tag count signal forCD 4TB relative toTN as in Fig 3B.DN ase‐Seq andRUNX 1 andETS ‐1 ChIP ‐Seq density maps showing the binding at theDHS s ordered as for (B), with average profiles ofRUNX 1 andETS ‐1 binding to thepDHS s inTB compared toTN shown below.JUNB ChIP ‐Seq inTB andTB + at theDHS s defined inTN andTB and ordered as in (B) with average profiles shown below.Patterns of
RUNX 1,ETS ‐1, andJUNB binding atRUNX ,ETS , andAP ‐1 motifs at the Trpm6 locus.

Hierarchical clustering of motif co‐association enrichments in
pDHS s. Z‐scores represent enrichment of observed versus background co‐associations computed in 1,000 randomly selected, chromatin‐accessible regions.Log2
mRNA expression levels of Runx1, Ets1, and B2m in untreated andPMA /I‐treatedTN ,TM , andTB from the microarray analysis.

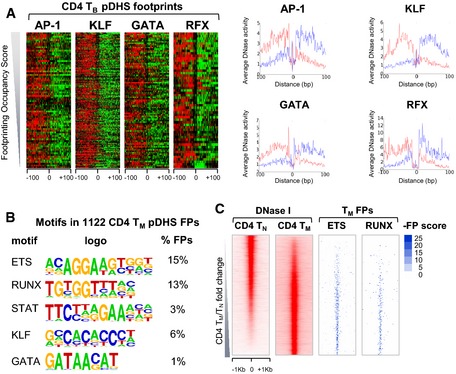
Enriched motifs defined by
HOMER using a de novo motif search of the digitalDN ase IFP s identified in thepDHS s inTB .DN ase I cleavage patterns inTB from theFP s determined by Wellington at thepDHS s centered on the motif named at the top and ordered according to increasingFP occupancy score. Left: Cuts are shown within a 200‐bp window with positive (red) and negative (green) strand imbalances inDN ase I cuts. Right: Average profiles of the actualDN ase I cuts at footprinted motifs within thepDHS s, with upper strandDNA cuts shown in red and lower strand cuts in blue.Average profiles of the
DN ase I cuts at footprinted motifs within thepDHS s inTM determined as in (B).Example of
FP patterns and motifs at the −3.7‐kb and −35‐kbpDHS s at the Ccl1 locus inTB .mRNA array values for Ccl1 expression.Luciferase reporter gene assays in stimulated Jurkat T cells performed as in Fig 1H of the
IL 3 promoter alone or in combination with the Ccl1 −3.7‐kb or −35‐kbDHS s, withSD . Values are expressed as the mean with the number of replicates for each (n) shown underneath.Footprinting of
AP ‐1 sites inTB +.DN ase I upper and lower strand cleavage patterns were calculated as in (B) (left) plus the averageDN ase I profiles (right) for allAP ‐1 motifs within the subset of 2,882 definedpDHS s inTB cells before and after stimulation, ranked in order of decreasingFP probability score.Distribution of the
FP probability scores for the data shown in (G).
Left:
DN ase I cleavage strand imbalance patterns within the footprints identified by Wellington at thepDHS s centered on the motif named at the top and ordered according to increasingFP occupancy score. Relative levels ofDN ase I cuts are shown within a 200‐bp window with upper strandDNA cuts shown in red and lower strand cuts in green. Right: Average profiles of theDN ase I cuts at the different motifs within thepDHS s, upper strandDNA cuts shown in red and lower strand cuts in blue.Results of the
HOMER de novo motif search ofpDHS digitally footprinted regions inCD 4TM .ETS andRUNX motif‐containing footprints (right) withinDHS s inTM sorted byTM /TN fold change (left).

De novo motif search of the 1,217
iDHS s usingHOMER .Motif distributions in the
DHS s ordered by increasingDN ase‐Seq tag count signal forCD 4TB + cells compared toTB cells as in Fig 4A.RUNX 1 andJUNB ChIP ‐Seq density maps depicting binding at allDHS s ordered as in (B).RUNX 1 andJUNB ChIP ‐Seq profiles forDHS s at the Il10 locus inTB andTB +.DN ase I cleavage strand imbalance patterns displayed as in Fig 7G for footprintedTF motifs inTB + at theiDHS s.Example of
FP patterns and motifs at the −15‐kb and −35‐kbiDHS s inTB + cells at the Ccl1 locus.
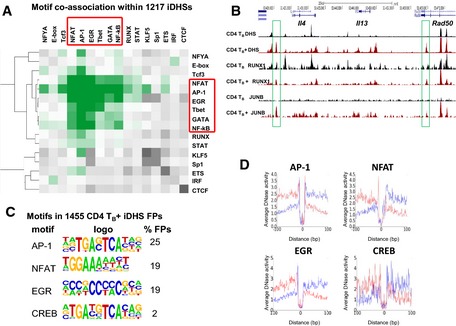
Hierarchical clustering of motif co‐association enrichments in
iDHS s. Z‐scores represent enrichment of observed versus background co‐associations computed in 1,000 randomly selected, chromatin‐accessible regions. Z‐score scale as in Fig 6A.UCSC genome browser shot of the Il4, Il13, and Rad50 loci showingDN ase‐Seq and ChIP ‐Seq forTB andTB +.De novo motifs identified by
HOMER withiniDHS digitalFP s.Average profiles of
DN ase I cuts at motifs within theiDHS s. Upper strandDNA cuts are shown in red and lower strand cuts in blue.

Motif counts for abundant
TF binding sites at the specificDHS s inTM ,TB , andTB +.Total motif counts for 5 inducible motifs (
AP ‐1,NFAT ,EGR ,NF ‐κB, andCREB /ATF ) and 5 constitutive motifs (ETS ,RUNX ,KLF ,GATA , and E‐box) in the specificDHS s inTM ,TB , andTB +. The motifs used here are defined in Dataset EV5.Overlaps between
ETS ‐1 andRUNX 1 ChIP peaks and the 2,882pDHS s inTN compared toTB .Mechanisms of
pDHS andiDHS regulation in T cells.
References
-
- Agarwal S, Rao A (1998) Modulation of chromatin structure regulates cytokine gene expression during T cell differentiation. Immunity 9: 765–775 - PubMed
-
- Araki Y, Wang Z, Zang C, Wood WH III, Schones D, Cui K, Roh TY, Lhotsky B, Wersto RP, Peng W, Becker KG, Zhao K, Weng NP (2009) Genome‐wide analysis of histone methylation reveals chromatin state‐based regulation of gene transcription and function of memory CD8+ T cells. Immunity 30: 912–925 - PMC - PubMed
-
- Badovinac VP, Messingham KA, Jabbari A, Haring JS, Harty JT (2005) Accelerated CD8+ T‐cell memory and prime‐boost response after dendritic‐cell vaccination. Nat Med 11: 748–756 - PubMed
Publication types
MeSH terms
Substances
Grants and funding
LinkOut - more resources
Full Text Sources
Other Literature Sources
Molecular Biology Databases
Miscellaneous
