. 2016 Feb 12;351(6274):aad5510.
doi: 10.1126/science.aad5510. Epub 2016 Jan 21.

Lineage-specific enhancers activate self-renewal genes in macrophages and embryonic stem cells

Affiliations

Lineage-specific enhancers activate self-renewal genes in macrophages and embryonic stem cells

Erinn L Soucie et al. Science. .

Abstract

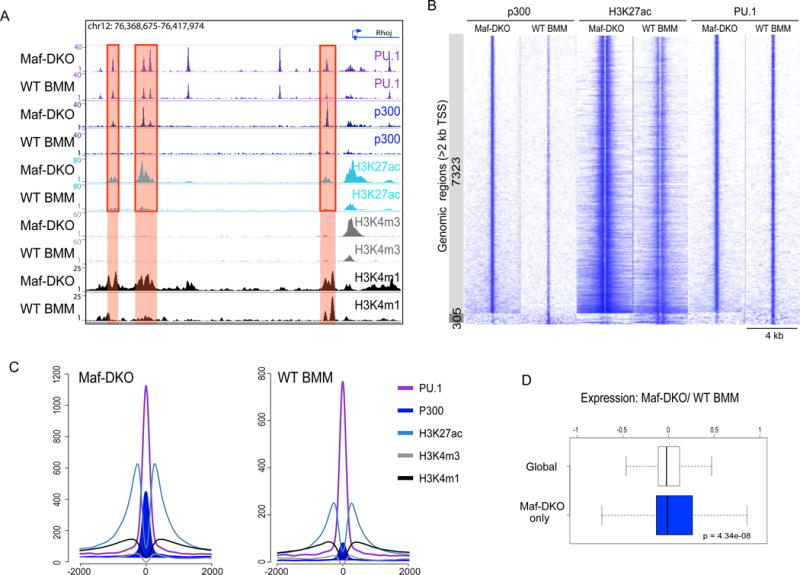
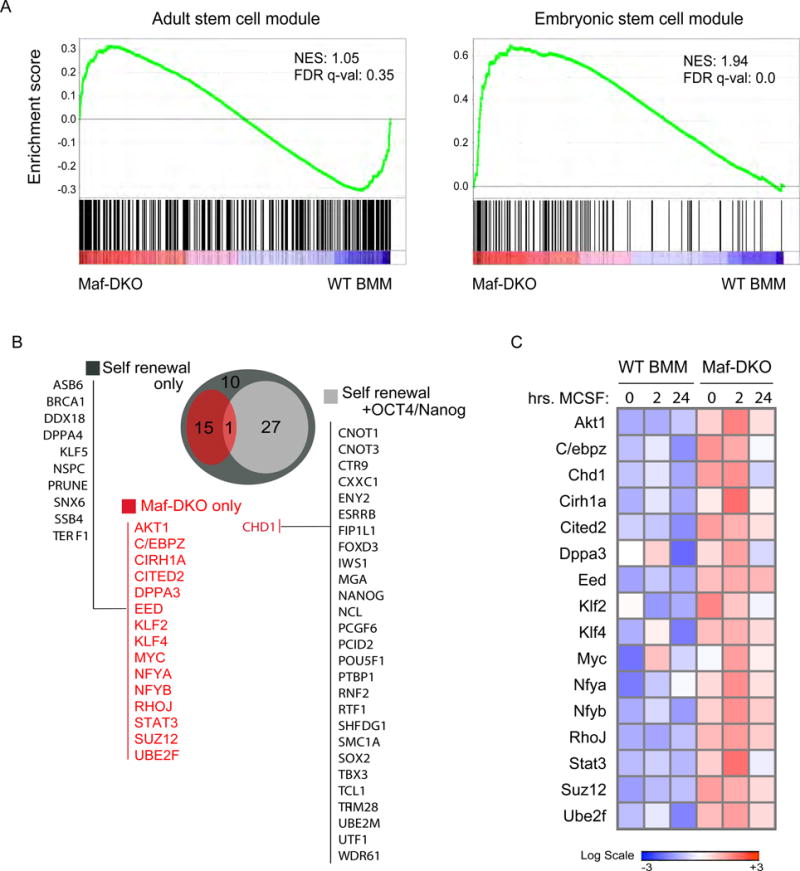
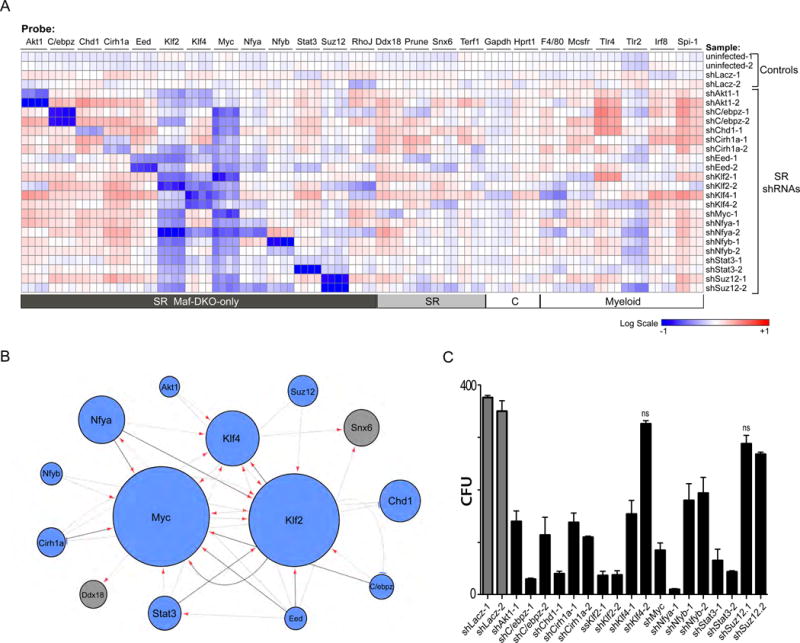
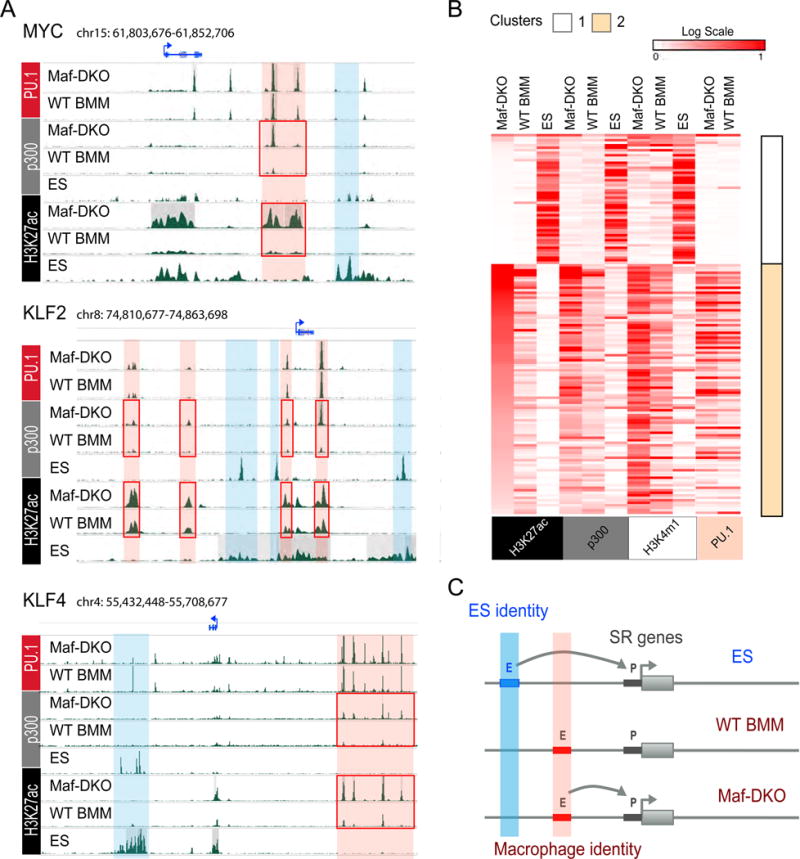
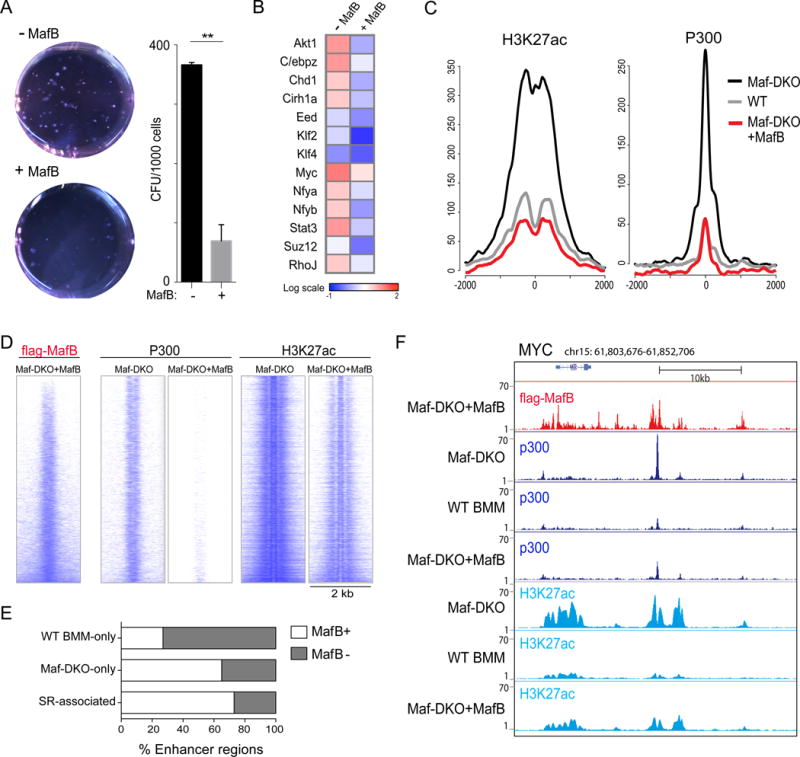
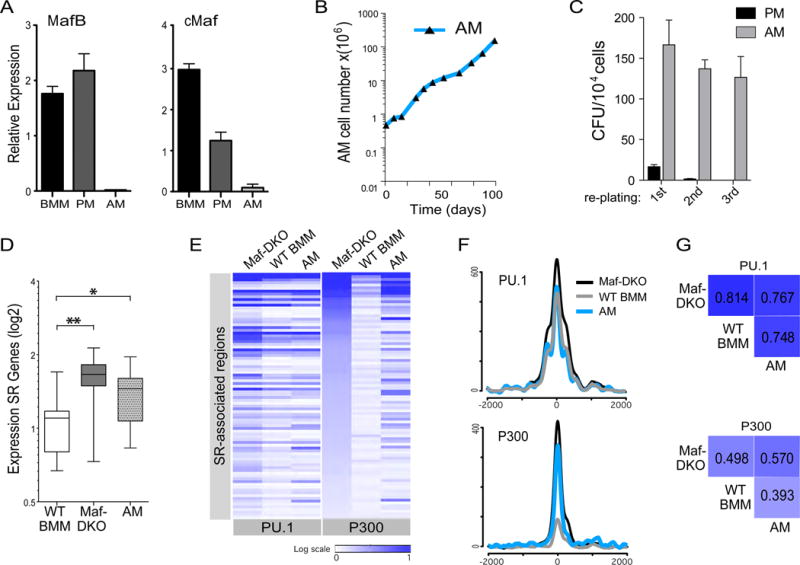
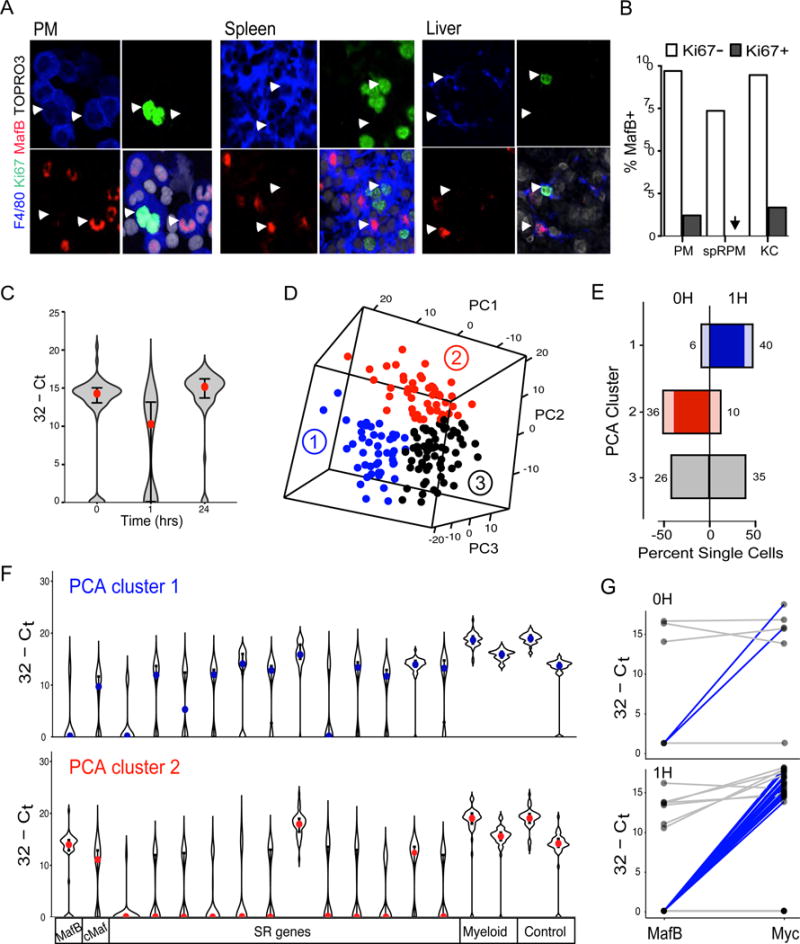
Differentiated macrophages can self-renew in tissues and expand long term in culture, but the gene regulatory mechanisms that accomplish self-renewal in the differentiated state have remained unknown. Here we show that in mice, the transcription factors MafB and c-Maf repress a macrophage-specific enhancer repertoire associated with a gene network that controls self-renewal. Single-cell analysis revealed that, in vivo, proliferating resident macrophages can access this network by transient down-regulation of Maf transcription factors. The network also controls embryonic stem cell self-renewal but is associated with distinct embryonic stem cell-specific enhancers. This indicates that distinct lineage-specific enhancer platforms regulate a shared network of genes that control self-renewal potential in both stem and mature cells.


Figures

Fig. 1
Fig. 1. A subset of lineage specific enhancers are enriched for activation marks in self-renewing Maf-DKO macrophages
A) Representative predicted enhancer regions (red shading) with greater enrichment for enhancer activation marks p300 and H3K27ac in Maf-DKO versus WT BMM (red boxes). B) Direct alignment of p300, H3K27ac and PU.1 ChIP-Seq signals for enhancer regions differentially enriched for p300 marks in Maf-DKO (7323, light grey) and WT BMM (305, dark grey), centered and ranked on p300 signal. C) Aggregation plots showing average ChIP-seq signals for PU.1, H3K27ac, p300, H3K4m1 and H3K4m3 marks in Maf-DKO and WT BMM for p300 regions specifically enriched in Maf-DKO macrophages (depicted light grey in (B)). For each protein target, Chip-seq analysis was performed on at least two biological replicates, and results were reproducible in all cases. D) Microarray gene expression ratios of Maf-DKO versus WT BMM 2h after M-CSF stimulation, for total genes (white) or genes associated with Maf-DKO-only enhancers (blue). The box extends from the first to the third quartile with the whiskers denoting 1.5 times the interquartile range. Data were derived from three biological replicates.
Fig. 2
Fig. 2. Self-renewing Maf-DKO macrophages activate genes required for ES cell self-renewal
A) Gene set enrichment analysis (GSEA) using gene sets defined by Wong et al. (21) for adult tissue stem cells and core embryonic stem cell modules (Broad Institute MSigDB M1999 and M7079). comparing the expression of genes associated with Maf-DKO-only associated enhancers in Maf-DKO versus WT BMM. NES, Normalized enrichment score; FDR, false-discovery rate. B) Diagramm of overlapping group of genes associated with Maf-DKO-only activated enhancers (red) and functionally validated self-renewal or both self-renewal and pluripotency (self-renewal + Oct4/nanog) activity in ES cells demonstrated by gene inactivation screens (–29). C) Gene expression by quantitative real-time PCR of self-renewal genes in Maf-DKO and WT BMM stimulated with M-CSF for the indicated times. Heatmap shows the average signal of technical replicates. Data are representative of four independent experiments.
Fig. 3
Fig. 3. Self-renewal genes are organized in a network and functionally important for Maf-DKO macrophage proliferation
A) Gene expression analysis of Maf-DKO macrophages uninfected or infected with shLacZ control or shRNAs targeting self-renewal genes (rows) for self-renewal genes associated with Maf-DKO macrophage activated enhancers, not associated self-renewal genes (SR), house keeping (C) and macrophage specific (myeloid) genes (columns) using quadruplicate nano-fluidic real-time PCR on Fluidigm array. For each gene, the heatmap presents normalized values as percent change over average expression in non-infected and control lacZ shRNA infected cell samples. Data are representative of three independent experiments. B) A network model using an FDR-approach showing significant repression of an output target gene resulting from shRNA knockdown of a regulator gene, with darker lines denoting regulation in all replicates, arrows denoting repression and blue bars activation by shRNA. Circle size is a function of the number of times the target is affected by knockdown of other regulators. C) Number of colony forming units (CFU) obtained from equal numbers of Maf-DKO macrophages infected with shRNAs against control (shLacZ) or self-renewal gene targets after 12 days of culture in methocult medium containing M-CSF. The mean number of CFU for self-renewal gene shRNA infected populations is significantly different from the mean number of CFU for controls (One-way analysis of variance, P<0.05) unless indicated (ns= not significant). Error bars represent standard deviation (SD) of triplicate technical replicates and data are representative of 3 independent experiments.
Fig. 4
Fig. 4. Self-renewal genes are associated with distinct enhancers in ES cells and macrophages
A) Genomic regions surrounding MYC, KLF2 and KLF4 genes showing distinct ES cell (blue) and macrophage (red) specific predicted enhancer regions with differential H3K27ac and p300 enrichment in Maf-DKO over WT BMM (red boxes). B) Heatmaps and k-means clustering (k=2) of Chip-seq signal of all H3K27ac+ regions associated with self-renewal genes in ES cells, Maf-DKO and WT BMM, including both differentially regulated Maf-DKO-only and non-differentially regulated regions. Corresponding regions are shown for p300, H3K4m1 and PU.1 (ES, Maf-DKO and WT BMM). C) Model based on panels A) and B) to describe tissue-specific macrophage and ES cell enhancer platforms associated with individual self-renewal genes.
Fig. 5
Fig. 5. MafB inhibits macrophage self-renewal by direct repression of self-renewal gene enhancers
A) Colony assays for Maf-DKO macrophages expressing empty vector (-MafB) or a doxycycline-inducible flag-tagged MafB allele (+MafB) counted after 14 days of culture in methocult medium containing M-CSF and doxycycline (DOX), showing culture dishes (0.63x), and number of colony-forming units (CFU). Error bars represent the SD of two technical replicates and data are representative of three independent experiments. B) Expression of self-renewal genes in Maf-DKO macrophages (-MafB) and Maf-DKO macrophages expressing a doxycycline-inducible, flag-tagged MafB allele (+MafB) after 2 hours stimulation with M-CSF determined by nano-fluidic real-time PCR on Fluidigm array. Data are representative of three independent experiments. C) Aggregation plots showing average ChIP-seq signals for P300 and H3K27ac in Maf-DKO, WT BMM and Maf-DKO macrophages expressing a doxycycline-inducible, flag-tagged MafB allele in the presence of doxycycline (Maf-DKO+MafB) for the self-renewal associated enhancers regions (total=88 regions). D) Direct alignment of regions proximal to Maf-DKO-only enhancers for flag-MafB binding in Maf-DKO+MafB and corresponding regions in Maf-DKO and Maf-DKO+MafB macrophages for P300 and H3K27ac binding. E) Histogram showing the percent of WT BMM-only, Maf-DKO-only and self-renewal gene-associated enhancers bound by MafB as determined by ChIP-seq for flag-MafB in Maf-DKO+MafB cells. F) Genomic regions surrounding MYC gene with Chip-seq tracks as labelled.
Fig. 6
Fig. 6. The self-renewal gene network is activated in alveolar macrophages expressing naturally low levels of MafB and cMaf
A) Expression of MafB and cMaf relative to HPRT1, measured by RT-QPCR, in short-term cultures of bone marrow macrophages (BMM), peritoneal macrophages (PM) and alveolar macrophages (AM). Data are representative of three independent experiments using biological replicates. B) Growth curve showing number of AM over time in liquid culture. Data are representative of two independent experiments. C) Number of colony forming units (CFU) counted at day 21 per 104 AM and PM plated in methocult medium after first plating, or after replating 104 cells washed out from first plating (2nd plating), or second plating (3rd plating). Data are representative of three independent experiments. D) Box plots showing average, inter-quartile and 5–95 percentile relative expression levels of all self-renewal genes in Maf-DKO, WT BMM and AM, measured by nano-fluidic real-time PCR on Fluidigm array. * p-value < 0.05; ** p-value < 0.01 based on an unpaired t-test. Data are based on the average signal from three biological replicates performed each with technical duplicates. E) Heatmap of ChIP-seq signal for all regions associated with self-renewal genes (total=88) in Maf-DKO, WT BMM and AM. Corresponding regions are shown for PU.1 and P300. F) Aggregation plots showing average ChIP-seq signals for PU.1 and P300 in Maf-DKO, WT BMM and AM for the self-renewal associated enhancers regions (total=88 regions). G) Pearson correlation matrix (PCA ranked log2 read number) for PU.1 and P300 binding to self-renewal gene associated enhancers (total =88 regions) based on ChIP-seq data for Maf-DKO, WT BMM, and AM. ChIP-seq analysis on AM for PU.1 and p300 was performed twice .
Fig. 7
Fig. 7. Single cell analysis of tissue macrophages in vivo reveals self-renewal gene network activation in MafB negative macrophages
A) Immunofluorescent (IF) image of MafB and Ki67 positive peritoneal F4/80+ macrophages in cytospun peritoneal macrophages (PM), and tissue sections from spleen and Liver. White arrowheads point to examples of Ki67−/MafB+ and Ki67+/MafB− macrophages, F4/80+, in each tissue. Data are representative of three independent experiments and larger field images are shown in Fig. S11. B) Quantification of percent MafB+ cells in the Ki67- and Ki67+ fraction of F480+/SYTOX blue+ resident macrophages from peritoneum (PM) n=969, spleen red pulp macrophages (rpSPM) n=425 and liver Kupfer cells (KC) n=302, corresponding to IF images in Fig. 7A and S11. Absolute cell counts are shown in table S1. C) Violin plot showing expression of MafB across single PM isolated from a mouse at indicated time points after i.p. M-CSF injection, measured by nano-fluidic real-time PCR on Fluidigm array. Red dots mark the median value and error bars the interquartile range. D) Depiction in three-dimentional space of PCA analysis of single cell gene expression data for a k-means=3 of pooled data for 0 and 1h after MCSF injection. Distinct PCA clusters are distinguished by colors and numbers. E) Histogram showing the percent of single cells in each cluster shown in D) in the 0 and 1H time point datasets. Absolute numbers of cells in each group are indicated and the net change between 0 and 1H is shown in deeper color. F) Violin plots showing expression for Maf, self-renewal (SR), myeloid and control genes across cells in PCA cluster 1 (blue) and PCA cluster 2 (red) from D). Colored dots show the median value and error bars the interquartile range. G) Line diagrams showing individual cell comparison of MafB and Myc expression for PCA cluster 1 at 0 and 1H. Single cells with low MafB and high Myc expression are highlighted in blue. Consistent results to C-G) were obtained in a repeat experiment with cells sorted from a pool collected from 5 mice at each time point.

References

    1. Jenkins SJ, et al. Local macrophage proliferation, rather than recruitment from the blood, is a signature of TH2 inflammation. Science. 2011 Jun 10;332:1284. - PMC - PubMed
    1. Schulz C, et al. A lineage of myeloid cells independent of Myb and hematopoietic stem cells. Science. 2012 Apr 6;336:86. - PubMed
    1. Yona S, et al. Fate mapping reveals origins and dynamics of monocytes and tissue macrophages under homeostasis. Immunity. 2013 Jan 24;38:79. - PMC - PubMed
    1. Hashimoto D, et al. Tissue-Resident Macrophages Self-Maintain Locally throughout Adult Life with Minimal Contribution from Circulating Monocytes. Immunity. 2013 Apr 18;38:792. - PMC - PubMed
    1. Sieweke MH, Allen JE. Beyond stem cells: self-renewal of differentiated macrophages. Science. 2013 Nov 22;342:1242974. - PubMed

Publication types